
Here’s the link to the new sales page: HDAFU Inflection Points Tables
As you may already know from our 2017 Summer League tables, you now receive three separate tables for each league purchased. (Except Australia, see below).
Why? Well, we had an idea in early 2016 and experimented with it. Read about that brainwave here.
Why should I buy them?
Because they are the most effective and successful method we know of building a lucrative portfolio of bets targeting the sweet spots in the odds range. Read about our successful Summer League campaign here and our successful Winter League campaign here.
How do I use them?
Full instructions plus a free HDAFU table download is available here.
You can mix Winter and Summer League tables in your order, and don’t forget to apply the discount codes for multiple purchases. (See green box immediately below).
Buy Your Tables Here!
PRICE(*): £35.00 GBP Per League
The following discounts apply for multiple purchases:
Buy 5, 6, 7, 8 or 9 leagues = 20% Discount (coupon code: SW20)
Buy 10 leagues = 30% Discount (10 for the price of seven) (coupon code: SW30)
Buy 11 or more leagues = 35% Discount (coupon code: SW35)
Please contact us (sales[at]soccerwidow[dot]com) should you have any questions regarding checkout and payment. For further clarification about the HDAFU tables please use the comment function below.
Should any of the above codes not work for any reason (It’s Javascript and some browsers may prevent the lightbox opening) please use the basic version of the cart to purchase your HDAFU Simulation Tables
The tables for sale are in Excel .XLSX format. Should you require a different format,
please feel free to get in touch with us by email.
(*)Prices are net prices ex VAT (Value Added Tax).
EU VAT rates will be added on the checkout page according to your location if in Europe.
Customers from the United Kingdom currently are not charged any VAT
Read more: EU VAT Information
Help with the Checkout
Open the scroll down list and click a league to highlight it.
Click on the Add to Cart button to include the item in your shopping basket.
Click Continue Shopping to add more items to your cart.
When you are ready to checkout, add your discount code (coupon code) if applicable (see multiple purchase discounts below), and click on Update Cart to register your discount.
Enter your personal details before clicking Continue Checkout at the bottom of the window.
You will then be given a choice of paying with PayPal or your credit card (via Stripe).
Contact us if you wish to pay via Skrill, Neteller or bank transfer.
Upon payment, download links for the files you have purchased will be automatically sent to your email address.
What You Get for Your Money
Instead of the usual one HDAFU table per league, you now get three. (Except Australia A-League, which is a whole season analysis only due to its size and lack of any recognisable mid-season break. The price of this table is now reduced to £10.00 GBP).
The new style tables presented here are also optimised for easy filtering.
Our recommendation is for a set of systems in several leagues, enough to provide you with a portfolio of at least 500 bets in a season. You’ll then have a chance of emulating our 2016 campaign.
Frequently Asked Questions
Is there a time restriction on the usefulness of the HDAFU tables?
The tables simulate the profits and losses by betting type for the last five complete seasons if choosing the same bet type for every game of the season. Therefore, the ‘natural’ cut-off point is the end of the following season when the tables have to be re-calibrated.
Simulating the profit/losses when betting on the same outcome over the last five seasons, the tables show a picture of the likely (expected) distribution for the forthcoming season.
If the bettor chooses a distribution which is equally spread over the year (e.g. underdogs in the German Bundesliga with odds between 4.0 and 17.0), then it doesn’t really matter when the systematic betting starts.
The HDAFU tables are a great help at any time throughout the season to provide focus upon profitable areas within your chosen league and allow you to refine your final bet selections.
Further reading:
Probability, Expectation, Hit Rate, Value, Mathematical Advantage: Explained
Avoid Placing Bets at the Start of Season
What is the relationship between the HDAFU tables and the Value Bet Detector?
The HDAFU tables simulate profit/losses when betting systematically on one specific bet type, e.g. backing the home win, the draw, the away win, the favourite or the underdog. The Value Bet Detector is an odds and probability calculation tool for individual/particular matches of interest.
Both tools originate from the time Soccerwidow wrote match previews for Betfair and needed to identify games containing value bets for analysis. Here is a summary of those predictions.
The HDAFU tables were initially developed as a tool to recognise clusters of matches that were far more likely to contain value bets, and thus provide filtered sets of matches to preview.
We often receive questions such as, “Can the HDAFU tables and the Value Calculator support each other?” or, “What is the relevance of the HDAFU tables?” or, “Which methodology is better?”
Ultimately, both products are tools for odds calculation and understanding the betting market. The Value Bet detector is an analysis tool for individual matches; the HDAFU simulation tables is better for systematic betting in larger numbers.
Further reading:
How do Bookmakers Tick? How & Why do they Set Their Odds as they do?
How Bookmakers’ Odds Match Public Opinion
How do I structure a portfolio and what is the best size for it?
“A portfolio is a package of bets where extensive analysis has determined the choices (picks)… This is an essential part of the whole betting strategy in order to reduce the risks of losing by diversifying.”
Now focus on the main expressions: extensive analysis… determined choices… whole betting strategy… reduce risks… and lastly… diversifying.
Actually, there is nothing more to say. Just spend some quality thinking time on it.
It totally depends on personal preferences, on the availability of betting markets to you, on your risk awareness, your understanding of probabilities and statistics, and finally, using all of this combined knowledge to make your best personal judgement, never losing sight of the fact that the bottom line is making profits.
Further reading:
Calculating Odds for League Newcomers is Unpredictable
1×2 Football Betting – How to Compile a Winning Portfolio
Are the HDAFU tables for both, back betting and lay betting?
Yes. Although the HDAFU tables directly simulate what happened from a backing perspective over the last five seasons, they are obviously reversible and provide a sound benchmark for formulating lay betting strategies.
Large positive figures and rising curves within the tables indicate promising back betting opportunities, whilst large negative falling curves point to potential lay strategies.
The HDAFU tables come with an odds toggle as well as an exchange commission toggle so that the user can adjust the base figures where necessary – This is of great importance to those wishing to accurately analyse lay strategies.
Don’t forget that betting exchange odds are often ‘higher’ than the highest bookmaker odds and, of course, have a built-in commission surcharge levied by the exchange platform. The effects of these variables can be gauged using the toggle functions within each HDAFU table.
Further reading:
1×2 Betting System: Analysis of HDA Data and Strategy Development – LAY THE DRAW
1X2 Betting System – Staking the Underdog
Why is concentrating on bet types more profitable than betting on teams?
The answer to this question is simple psychology, which often defeats the average punter.
There are millions of people who follow one or another team. They read all the news available, discuss form, players and managers, and everything else there is to think about when a match involving “their” team is coming up.
There are plenty of “must win” situations, and even if the odds seem a little short, bets are still placed on the team they support to win the game. Both reliance on luck and a lot of hope goes into each game.
Unfortunately, gut feelings are very often a false friend and team news also has no relevance to the ‘true odds’ of a game; little wonder that there are more losing punters than winners.
The HDAFU tables help the gambler to disconnect all emotions from betting. The figures show very plainly where to concentrate when compiling a betting system portfolio for profit.
Further reading:
Finding Betting Odds Inflection Points
Half-time Results are more Predictable than Full-time
What do you recommend to read for better understanding of the HDAFU tables?
HDAFU Tables Knowledge Base
1X2 Betting System – Staking the Underdog
How to Compile a Winning Portfolio
Finding Betting Odds Inflection Points
Odds Toggle Function
HDA Betting: Profit/Loss Simulation Tables
PRODUCT SUMMARY
- Format: Excel .XLSX (compatible with Excel 2007 and higher, LibreOffice, Google Sheets, OpenOffice, etc.)
- File Size: between 623 KB and 2.85 MB each
- Publisher: Hertis Services Ltd (former Soccerwidow Ltd); 5th revised edition
- Simulations within each Workbook: Home Win, Draw, Away Win, Favourite & Underdog, plus a breakdown of individual teams’ performance in each bet type from both a home and away perspective.
- Language: ENGLISH
By purchasing this product you agree to our Terms and Conditions and Privacy Policy.
After payment you will be redirected to download your purchased product(s). You will also receive an e-mail with a confirmation of your purchase and download link from DPD (our partner for storing and delivering of digital products) as well as from PayPal (our partner for secure payment processing).
PayPal is an online payment service that is world-wide used for processing secure payments on the Internet. Paypal supports all major payment methods such as direct debit, credit cards and deposits. Should you wish another payment option then we also offer Neteller, Skrill (Moneybookers) or bank transfer. Check here.
Customer Comment
The results of your 2016-17 campaign are fantastic. I’m going to go through your campaign in detail and learn what I can about how and why you put it together and then hopefully go some way toward achieving what you guys did in that season.
One other thing I wanted to say about what you offer at Soccerwidow….the material – free and paid for – is so valuable and really does teach people what they need to know in order to understand the betting market and what is profitable and what is not, the pitfalls and the best way forward.
I’m very much like you in that I don’t see the value in blindly following someone else picks, but when someone doesn’t know the betting market or how to go about it themselves, blind following is what a lot of people gravitate towards.
With your products they really do teach people and empower them to be able to make their own decisions and do things the right way. I feel I have learned a tremendous amount since I found your website and am very much looking forward to putting it into practice in this upcoming football season.
Great job on what you guys do at Soccerwidow!
Simon


Thank Right Winger. Another question. When i adjust the toggle function even by -1% all the tables that are positive are now negative and the negative ones are even more negative. Given im not based in the UK (for EPL) and dont have access to all the bookies its not reasonable to expect me to get close to the odds and -1% probably isnt low enough. im surprised about the massive impact this is having making most of the strategies unsustainable…am i reading this right?
Hi OCW,
Yes, we phased out the calendar month analysis becuase it was an unreliable guide. The reason for this being that every two years various leagues begin earlier than usual and end earlier to accommodate the World Cup or the European Championship tournaments.
Working on our prescribed five seasons’ data set (for statistically significant results) would mean we would need at least 20 years’ data to see any noticeable trends from these early league starts/finishes.
I hope you’re not too disappointed. As an aside, we will probably add a day of the week analysis to any future HDAFU tables, which is a useful guide when combining several systems from different leagues.
Best wishes and good luck.
Hi there,
Just wondering if its just me or the EPL FT HDAFU excel sheet doesn’t come with the Calendar Month Analysis?
Useful information, thanks for providing this useful resource.
Thanks!
Hello Cobber,
Yes, our attitude has changed down the years. We no longer ‘favour’ ante post lay betting as much as back betting. This is purely because in order to place an ante post lay bet in an exchange you usually forfeit any value in the bet because you are constantly buying a price which is above the backing odds – and then you have to take into account exchange commission.
In the long run, ante post lay systems tend to be poor performers whether you use a fixed stake or a fixed win plan, although we previously favoured the latter to smooth out the huge profit/loss peaks and troughs that can occur.
The real advantage of lay betting is ‘in-play’ and we would therefore advocate lay bets for traders rather than system bettors.
We use fixed stakes in the HDAFU tables for two reasons:
1) For back bets, fixed stakes definitely perform better than fixed win, especially with underdog betting.
2) By simulating with fixed stakes, all negative totals for the bet types analysed indicate laying strategies – we therefore don’t need to duplicate the tables with lay odds. The exchange commission toggle is present in the tables to simulate the effects of backing (or laying) with exchanges. (Of course, you can always change the 100 units stake to whatever figure you wish to use).
To summarise, we rarely touch ante post lay betting but if we were to return to it, then it would be on a fixed win basis. For ante post back betting, we always use fixed stakes.
I hope this clarifies the situation and many thanks for your valuable question.
Looking at articles on the site i notice you mention you advocate fixed win staking. i recently purchased a HDA table i was wondering why you calculate the numbers based on fixed stake of $100 yet advocate throughout the site fixed win staking. Looking at the back the underdogs numbers for example if i change it away from fixed stake to fixed win (which means im putting on less $ on long shots) it changes from making money to losing money.
above you say you now do fixed stake. Which one are you using now for all of your systens?? cheers
Mike,
Everyone has their own preferred method. We use the last five seasons’ statistical data for every league we analyse – for a statistically significant pool of data.
I would suggest that 1.5 seasons’ worth will provide too small a data set to see trends and to confirm them.
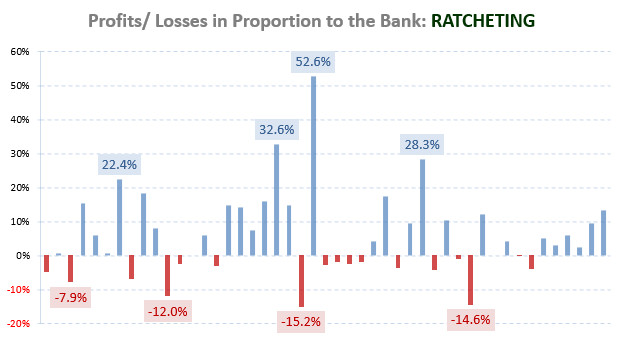
With stakes, we use fixed stakes for backing and employ a ratchet method to slowly increase stakes as the bank increases. For lay bets, although we no longer favour them, we would always lay to win the same fixed amount every time.
You will of course need to paper test any theory you decide to follow up although for the sake of historical data we always use closing odds as our standard benchmark. Nothing wrong with opening odds as long as you then place your bets at the start of the market too – just more time-consuming to collect that data manually and from my observations, opening odds only provide the largest odds available during ante post for some odds on favourites and rank outsiders only.
Hope this helps!
@Right Winger
Thanks for answering my Inflection Points for Home Wins for the English Championship question.
[Another Question]
I have keep track and stored in my database all the opening odds of my local bookmaker over 1.5 years for all leagues offered. I been thinking to devise a 1X2 bet system based on opening odds.
Eg. EPL Match 01: 1:$1.90 X:$3.10 2:$3.20
I will search my database for similar opening odds of the SME league -> EPL and calculate how many times EACH home win, draw and away win occurs for all similar opening odds.
I then convert frequency% to Fraction x current live odds.
Eg. Total home win occurs 60% for all such similar odds = 0.6
Current live odds offered for home is $1.70 (dropped from $1.90)
Current Value bet = $1.7 * 0.6 = 1.02
Then I use kelly bet formula to calculate a optimized bet stack.
Did you do this before, do you think it will work? What are your views?
Hello Mike,
Regarding lower leagues, see my response above dated 25 September, point 1.
Because the demand for bets in lower leagues is far less than premier leagues, bookmakers tend to reduce odds across the board.
The trend you have seen in the English Championship is a combination of these reduced odds and higher ‘statistical noise’ created by the fact that there is promotion and relegation in lower leagues. A greater turnover of teams over five seasons certainly affects the results distributions, as fewer teams are ‘ever-present’ during those five seasons.
If you want my advice, stick to the top leagues in each country only.
Hello,
I have been following your articles on 1×2 betting and was able to create and find my own tables from which I produced an inflection points graph.
I manage to create the graph for Inflection Points for Home Wins for the English Championship using my own data-set. However, as you can see, the graph is towards downward trend all the way.
In such cases, where is the inflection points?
Hi MustWin,
1. The problem with lower leagues is that they are not very popular with the majority of punters and bookmakers underprice these leagues across the board as a result. When it comes to preparing HDAFU tables for lower leagues, you invariably find red numbers in every bet type. This would indicate these leagues are ideal for laying but of course they are not popular in Betfair either – the prices you find there can never lead to long term profits.
2. Time is of the essence – we simply have no time to turn these things into a jack-of-all-trades (although it would be nice!). I agree, Asians would be very interesting to see when extrapolated over five seasons.
3. I cannot guarantee anything at the moment. The HDAFU tables are the pinnacle of insight when it comes to deciding what to bet on but very few people seem interested in them. We do not know whether these will be continued in the future. A huge amount of time goes into them and it’s simply not paying I’m afraid.
Thanks for your questions and for your interest in Soccerwidow.