An inflection point is a point at which the curvature of a curve changes direction, that is, the curve changes from being concave (concave downward) to convex (concave upward), or vice versa.
What does this have to do with betting?
 Image: FXQuadro (Shutterstock)
We speak about ‘Inflection Point graphs’ in our HDAFU Profit/Loss simulations because these graphs have turning points. Turning points are points at which a significant change occurs.
In layman’s language – Turning points are the points in the ‘inflection point graphs’ where profits turn to losses or, where losses turn to profits.
For the mathematicians amongst you, we use the term ‘turning point’ although the academically correct mathematical expression would be ‘maximum’ and ‘minimum’.
However, ‘maximum’ and ‘minimum’ in normal language signifies ‘best’ and ‘worst’ but turning points in a curve have nothing to do with any judgement of being ‘good’ or ‘bad’.
Apologies for any academical incorrectness in the use of the terminology, but somehow we have to make ourselves understood by everybody…
Home ~ Draw ~ Away Profit/ Loss Curves
If you have ever calculated your own odds you will certainly have noticed that bookmaker prices often do not show the ‘true’ picture.
In other words, their odds seldom adhere to mathematically calculated values (the statistically expected values).
In the majority of games, odds are either higher than mathematically expected or lower…
Is That Really True? Can You Prove That?
Here’s an image showing the Profit/Loss Curves for betting on the Home win ~ Draw ~ Away win with equal 100 units stakes over a period of five seasons; the straight red line is the bookmakers’ profit trendline:
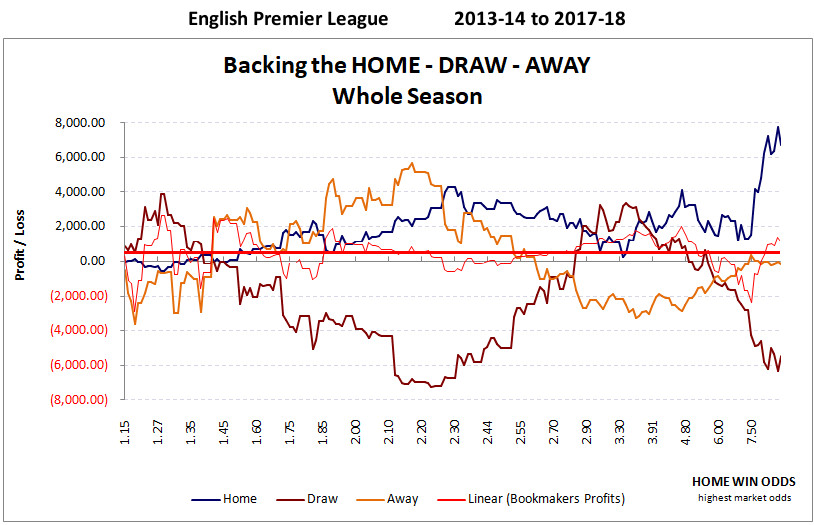 English Premier League – Profit/Loss curves by ODDS for 2013-14 to 2017-18 seasons
What you can see in the above graph is that if one curve rises, e.g. betting on the away win if the home odds are between 1.7 and 2.15 (orange curve), then another curve falls.
In this example, betting on the draw (brown curve) produces a loss for the bettor and hence, a profit for the bookmakers.
What is most revealing in the above graph is the red curve. It shows how the bookmakers profits vary depending on the home odds, but the most interesting part is the straight line, the red trendline. It is positive for all odds and perpendicular. The interpretation of this is that for the bookmakers it doesn’t matter in which cluster a particular match is in (in the example, home odds), their odds guarantee them the same constant profit across the whole spread.
Why Is This So?
A bookmaker’s aim is to make a profit and they price their odds to ensure that sufficient action is taking place on both sides of a bet, with enough profit retained whatever the outcome.
In addition, bookmaker betting odds are often adjusted according to public opinion to guard against a disproportionately large amount of money being placed on just one side of a bet.
How can the Bettor Make Use of This Knowledge?
The bettor can take advantage of the knowledge that each betting market contains certain odds clusters that are regularly under-priced, whilst other odds clusters are habitually over-priced. But attention, please! These under- and over-priced clusters are different from league to league.
Bookmakers take into account gamblers’ preferences and these vary depending on the cultural background (e.g. risk-aversion) of the locals. This is perhaps because local bettors are the majority takers for any league bookmakers, so bookmakers take local tastes into account.
It is obvious that, for example, Italians will be betting primarily on Italian matches; Spanish people on Spanish matches, and so on.
However, please be aware that the EPL, the most prominent league in the world, naturally has a huge amount of supporters worldwide. This makes the EPL the most unreliable league (system betting-wise) in terms of its odds. Although odds patterns can be spotted easily, it is always a gamble whether or not they will be returning a profit the forthcoming year.
Nevertheless, for this article, we will use the EPL as an example.
The Significance of the Turning Points on the Inflection Point Graphs
Profit turning points can be easily spotted in the Inflection Point tabs of the HDAFU Simulation Tables using visualisations (see example below) in the form of Profit/Loss curves based on five seasons’ data within these tables.
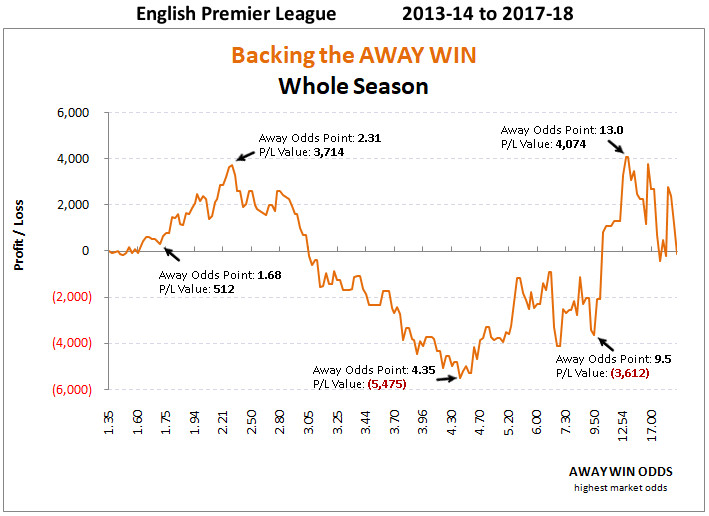
For example, the EPL: Between 2013-18, if you had gambled unemotionally and systematically on all English Premier League matches to be away wins (at the highest bookmaker odds) and placed a constant stake of 100 units per fixture, then at the end of the fifth season, you would not have seen a large change in your bank: -125 units after 1,900 bets.
Huge losses would have been incurred, had you backed all of the away teams to win and limited your betting to the zone of odds between 2.31 and 4.53. Within this zone your losses would have totalled -9,189 units (3,714 plus 5,475).
However, if your strategy had been based on away wins at odds from 1.68 and up to 2.31, after five seasons your profit would have been 3,202 units (7,714 minus 512).
That’s quite a difference, isn’t it?
English Premier League – Profit/Loss curve for 2013-14 to 2017-18 seasons
Just as a side note… Can you see yourself betting on an EPL match targeting odds between 2.3 and 4.5 when backing the away win?
Different Leagues = Different Inflection Points Graphs
The above screenshot shows the Profit/Loss curve for the EPL if back bets on the away win were placed on all 1,900 matches between 17/08/2013 and 13/05/2018 (at 100 unit stakes).
You can see from the graph that the first turning point is located at 2.31 on the ‘away odds’ axis. At this point, the P/L curve reaches a peak of 3,714 units profit before starting to fall again. The decrease in profits continues until away odds of 4,35 are reached (P/L value: – 5,475 units), where the curve turns for a spell but remains negative until away odds of 9.5 are reached. Then it experiences a large jump before falling again.
Now, we compare this to the German Bundesliga Inflection Point graph:
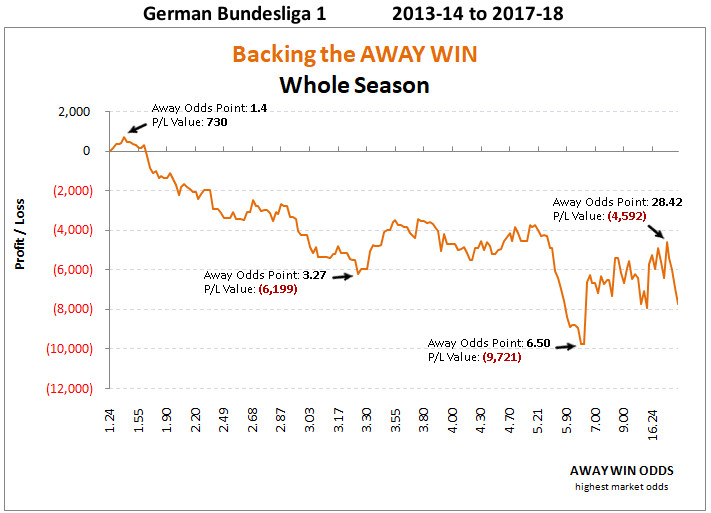 German Bundesliga 1 – Profit/Loss curve for 2013-14 to 2017-18 seasons
You can see at a glance that both graphs are very different.
Whilst the EPL shows a rising curve (profits) until odds of 2.31 the Bundesliga P/L curve starts to drop straight away from odds of 1.4.
This indicates that the bettors on the Bundesliga are probably much more risk-averse than EPL bettors and it seems that they prefer betting on favourites (lower odds). Using this mentality bookmakers can reduce their odds in this group to optimise their profits and hence, the draw odds and/or home odds are likely to be increased.
Once you start working with inflection point graphs you will not only see the various profit /loss curves (whole season, 1st half and 2nd half) and start recognising patterns but you will be also amazed to learn about the different mentalities of bettors in different countries.
Working With the Inflection Points graphs using the HDAFU Tables
Here’s a handy little tutorial:
Notes: Adjust the picture quality at the bottom of the screen above by clicking on the ⚙ button (to the left of the YouTube logo), then click on ‘Quality’ and choose a higher resolution as desired. Go to full screen mode by clicking on the box symbol (to the right of the YouTube logo).
How to Use the Knowledge of Turning Points
(1) check your betting pattern
Do you recognise your betting patterns within the most common odds clusters; those which show a falling Profit/Loss curve? (For example, betting on odds between 2.3 and 4.5 when backing an away win in the EPL).
If so, perhaps reconsider your strategy and avoid the odds used by the bookmakers to make their profits. Of course, no matter how hard you try, betting in the zones where bookmakers habitually reduce prices (odds) is asking for long-term losses.
It is very rare for people to succeed in any walk of life by swimming against a strong current and you can safely assume that the bookmakers know their job and have for centuries been making a living from manipulating figures.
(2) don’t even try to “beat” the bookies
Swim along with them. ‘Play’ the market the same way as they do. Start looking at strategies which are not in conflict with the market, but in rhythm with it.
(3) be aware that each league has a different market behaviour
Customs and habits of people vary from country to country. Every nation has different culture or cultures. Surely everybody has noticed regional differences expressed in such tangible goods as food or housing. However, these differences extend into how people think and act.
Unfortunately, differences in betting patterns and the subsequent reaction of bookmakers when setting their odds cannot be spotted without taking a mathematical approach. Customer habits, especially in the betting market, remain well hidden from the bettor.
Whichever league you prefer betting on, identify the odds clusters which are utilised by the bookmakers to turn their profits – and then work around those clusters.
(4) use the market turning points for your own benefit
Concentrate on developing your personal betting strategy by taking the market rules into consideration.
(5) find a strategy and identify matches for producing long-term profits
Using the HDAFU simulation tables and finding the various turning points will provide you with the need knowledge of odds clusters you need to produce a long-term profit when backing.
If you already use our Value Bet Detector for calculating odds for individual matches then the knowledge of profitable odds clusters will help you to pick matches which are worthwhile re-calculating.


Hello Soccerwidow,
i have a questions to your Inflection Points Graphs.
i have seen that you use Graphs helper for that.
There i can see that u have built cluster.
Example “IP´s by odds”
starts with 1<=1,18 then 1,18<=1,20 then 1,20<=1,22 and so on..
so my question for that is did you built it arbitrary? or why do you use this selection?
Regards,
Hi Sam,
If you take all 1,900 games and group them into 200 percentiles then you’ll come up with the data in the ‘IP’s by Odds’ tab you’re referring to.
Sorry, I’m not going to give away the formulas or any more explanations on the mechanics of the tables. It is already hugely time consuming to explain what the tables do and how they can be utilised for identifying profitable betting systems but please don’t expect us to give away the secrets how we build them.
Hello Madam,
When you say “1,900 games and group them into 200 percentiles”
On which basis you group these matches ? Are the 200 percentiles based on the odds?
Thank you !
Hi,
Thanks for a great site, the articles are really useful and i’ve learnt a lot on betting theory from over the past few weeks.
While reading through this page, i noticed that in the “How to Use the Knowledge” section, number five mentioned your value bet detector.
Do you think it’s necessary to purchase and use the value bet detector in addition to HDAFU tables?
Cheers,
Hi Phil,
if you are into system betting and wish to use the HDAFU Tables for developing a profitable portfolio of bets, then no, you won’t need the Value Calculator.
However, if you a ‘Value Bettor’ meaning that you prefer to calculate individual matches and place individual bets, then you will probably benefit from using the Value Calculator in conjunction with the HDAFU Tables to cross-check profitable clusters when you have calculated your 1×2 bets.
These are two totally different approaches of finding an edge.
Thanks very much for your reply.
Keep up the good work!
Hi team. First and foremost I love Soccer Widow as a betting resource!
I was just wondering if analysing more seasons (say 10 instead of 5) would better help analyse the demise and birth of different systems/trends?
For example, being able to see a clearer picture pre/post the introduction of VAR? COVID restrictions from harsh to easing?
Might give a clearer picture of the effect of events like these?
Anyway just a point I’d love to get your feedback on.
Many thanks, Sam.
On the back of that, I thought more seasons covered might also better illustrate maximum profit points as well as maximum draw-downs which might give a better stop point if it turns out you’re stuck in an anomalous/bad season?