We decided not to remove this post from the site because of the many questions and answers in the comments section. For those of you with curious minds it may also be quite interesting to see how our HDAFU Tables have developed over the years.
Read about: The Power of the 7th Generation of The HDAFU Tables
Our HDAFU tables have evolved tremendously over the years. They are a complete statistical analysis of historical performance over the previous five seasons of the Home win, Draw, Away win, Favourite win and Underdog win (H-D-A-F-U). They serve to identify the most profitable odds ranges in each bet type.
To help you understand why we value this product so highly, here is our Definitive Guide for using the 5th Generation tables to their maximum potential.
It’s difficult for us to put into words how important the HDAFU tables are to us and our own betting adventures. But what we can say is that we have complete confidence in them to do their job. And from testing them in a live setting, we know that they are an extremely reliable method of building lucrative betting portfolios.
Quite simply, they are the best and most user-friendly tools available for nailing down value betting systems in every league you apply them to.
They reveal the DNA of a league, and provide a hidden level of detail that makes finding and exploiting the sweet spots so easy and so rewarding.
The next six steps will probably change the way you think about betting…
Step 1 – Observation
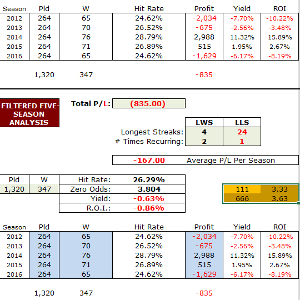
By default, the HDAFU tables open on the Data Tab showing the financial summary of each bet type. Here are the figures from an example league.
(Click on the image below to enlarge it in a new tab):

The totals along the top row show the effects of betting on every match over five seasons. In our example league the totals are (from left to right) Home win (-7,329), Draw (-835), Away win (+8,236), Favourites (-2,594), and Underdogs (+3,501).
You can see from this graphic that away wins look the most promising backing system with a profit of 8,236 units from 100 unit stakes.
To customise the stake amount enter what you want in the Fixed Stake box at the top of each bet type in the Data Tab.
The image above shows the full five season cold analysis. If you enter a different stake amount the financial values will change, but the percentages will always remain the same. This being the case, we have fixed these percentages as a benchmark to better gauge the improvements we will make with our filtering exercise later.
The Odds Toggle is for testing the effects of the odds you are getting when playing the systems for real – you can ignore it during your analysis.
You can also leave the betting exchange commission rate at zero. Again, use it for backing system monitoring purposes when you start betting on or paper testing your systems of choice.
Okay, we fancy away wins in this particular league but let’s now have a look at the Inflection Points Tab to see if this backs-up our observation.
(Click on the image below to enlarge it in a new tab):

Away wins are certainly financially the most profitable bet type but the profit curve doesn’t really begin rising until odds of 3.30 are reached. Overall profit at this point is 463 units and this rises to a peak of 13,502 units around odds of 8.60.
These two points on the graph would therefore be our two inflection points: Odds of 3.30 where the curve begins to rise; Odds of 8.60 at the pinnacle, the point at which profits begin to fall again.
However, notice there is a big portion of the away wins curve which is a zero-sum game. This ‘hole’ in our profit curve begins around odds of 3.75 (6,653 units). At this point, the curve falls away again, encounters what we call ‘statistical noise’, and only recovers at odds of around 6.52, when the profit figure surmounts its previous high at 7,184.

In between these two points is the potential for a lot of wasted effort and not a lot of gain.
We can see the extent of this by scrolling down and looking at the inflection point intervals.
(Click on the right-hand image to enlarge it in a new tab):
This image shows the start of the 3.75 odds sector at the top and the end of the 6.52 odds sector at the bottom.
The yellow column indicates the running total of matches up to each cluster of matches.
We can see that our two odds of 3.75 and 6.52 encompass roughly 330 matches – the difference between 1,115 indicated at the 6.52 break-off point and 785 at the starting point of the 3.75 cluster.
That’s 330 bets over a five season period that are simply not worth making; or 66 bets in a season.

We can see this clearer by looking at the same snapshot between our original inflection points of 3.30 and 8.60.
:(Click on the left-hand image to enlarge it in a new tab)
In this odds range, we have roughly 587 bets (1,221 minus 634). We now know that more than 56% of these (330 bets) are not worthwhile making.
This leaves only 257 bets but the away win profit sectors between the inflection points seem to be split into two areas of the curve: from odds of 3.30 to 3.75 (medium risk system, accounting for around 160 bets), and then from odds of 6.52 to 8.60 (high risk system; around 100 bets).
If we were to continue our analysis of away wins we would eventually see that the three elements (the medium risk sweet spot, the high risk sweet spot, and the statistical noise in-between) combine to give us a bumpy ride.
Our expected hit-rate will be tempered by that area of noise, and yield will be lower because of the size of the zero-sum area and the number of pointless bets within it.
This means a lot of unpaid work to perform, placing many bets that maintain the status quo and not much else. On top of this, the losing streaks will be greater.
Therefore, why not split into two systems in this league?
The synergy we have mentioned before about many systems supporting each other is what makes the HDAFU betting systems so viable.
However, we also mentioned that you should find the single best system in a league to play alongside the other best systems in the other leagues within your portfolio.
In our away win example, we would need to choose the better of the two systems we have identified. Either backing away wins at odds between 3.30 and 3.75, or between 6.52 and 8.60. Choose one or the other, not both.
We recommend never to play multiple systems in the same bet type. The synergy effect is diminished as ultimately, one of the two systems is not the best we can find.
Ideally, we are looking for synergy between the absolute single best systems in each league within our portfolio, without creating a situation where one system supports another within an individual league.
With different bet types in the same league (e.g. 1×2 market and over/under goals market) this is not an issue, but we would go as far as avoiding the conflict of interest between HT and FT 1×2 systems in the same league, for example.
Away wins initially looked great but is there something better?
Have a look once again at the Inflection Points graphs to try and see what it is.
As is typical of an underdog backing profile, the high risk/high return nature of this bet type produces a noisy curve, one full of jagged peaks and troughs. There are only small rising areas to analyse. Anything you can analyse into promising profits will contain few betting opportunities in a season, with long runs of losing bets to cope with.
Backing the favourite has one area between odds of 1.90 and 2.10 but we can see at these odds not a huge profit is created over five seasons (less than 3,500 units).
The home win is a misery for backing. Again, the sweet spot is between 1.90 and 2.10 but the profit is less than 2,000 units.
That leaves us with backing the draw. There is a large, rising area in the curve beginning at draw odds of 3.32 (-2,008 units), and peaking at 3.65 (7,170 units). It represents a potential profit chunk of 9,178 units over five seasons.
This is better illustrated by superimposing our inflection points onto our graph – We are interested in only the portion of the curve in-between the red arrows:
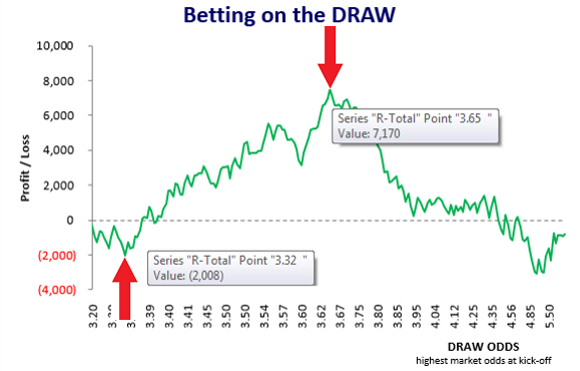
The shape of this curve is what you should be looking for when identifying the first system to analyse in your leagues of choice.
It is the classic, gently rising curve from bottom left to top right. It is relatively smooth, with a far smaller amount of statistical noise.
Therefore, this is the bet type we will analyse as our example.


Hello,
Great Job Right Winger !
How many bookmakers do you select on Oddsportal to find the best odds:
only premimum bookmakers automatically selected by Oddsportal;
Every bookmaker;
Another selection?
Thanks a lot.
Hi Sellig,
Good question.
We have no choice with those automatically selected by Oddsportal as they do not allow you to deselect them.
We add a selection of the more reliable bookmakers to this list, but not all of them.
We scrape our odds from a selection of around 30 bookmakers in total (including the compulsory ones).
There is a problem with Oddsportal where odds do not update from certain bookies, or sometimes they update after the match has started with in-play odds, which have to be discounted.
Our odds are therefore carefully checked and compiled – it takes hours to scrape the odds we want and to check that they are viable.
I hope this helps!
“The number of betting opportunities and the hit-rate should both show fairly consistent figures throughout the five seasons.”
How do we know that it’s consistent ? Minimum number of bets for a season ?
Hello again Sellig,
By consistent we mean that the numbers of bets in each of the five seasons should be more or less equal.
This also applies to the hit rate, which should be fairly even over the five seasons, with no huge anomalies.
Hi Right Winger,
how do you determine if betting opportunities or hit rate has too big deviations?
Hello again Jo,
I’ve been trying to backtrack for the answer to your question as, after many years of analysis and betting, identifying deviations almost becomes second nature.
Firstly, I think that ‘anomalies’ is probably a more useful word to use than deviations.
The number of potential bets covered by a system and the expected hit rate from it are usually pretty uniform when looking at a filtered set of data from five seasons.
Anything that stands out from the pack should be looked at more closely. Was it an anomalous season that caused the deviation? Is there a history of anomalous seasons in that particular league? Are there any other reasons for the anomaly?
Certainly, if the betting opportunities are anomalous in one of the seasons analysed this can point to a change in odds setting for that season, perhaps due to the composition of the league (i.e. an historically strong team is relegated and replaced by a far weaker team, which has a knock-on effect in the odds compilation).
Filter the results in your chosen system by team, and see if there any anomalies there. You may even be able to filter out certain teams from your analysis – ones that continually let the system down, for example. See if this makes any difference to the deviations you can see.
I hope this helps!
I have a few questions regarding the HDAFU tables:
– Would it help to add in more seasons to the analysis?
– Would it help to weight the seasons?
– Do you backtest your picks? For example, omit betting on the first 25% of the season, use these matches to validate, and then start betting on them. And if so, how about splitting the season in half?
Thanks!
Thanks for the good questions, JVR,
Yes, we performed literally years of analysis before settling on five full seasons of data. It doesn’t seem to make a significant difference adding any more. In fact, adding further seasons tends to dilute the data pool with information that becomes more irrelevant the older it is.
So, five seasons is enough to provide a data pool which carries statistical significance, and that’s all we need when analysing any snapshot of past performance. You can add more seasons if you want (and create more work for yourself), but the fringe benefits of the extra stats become more and more negligible the further back in time you go.
And don’t forget, maths is not an exact science. Our aim is to get as close to the answer as we can, knowing that there is never an absolutely correct one.
My feet are different sizes for example. Most peoples’ are. Almost all people buy their shoes from a shop. We buy shoes that fit as best they can but they are never a ‘perfect’ fit for both feet. But they do the job they are intended to do. This end result metaphor is all we can ever hope to achieve with a statistical analysis – it will never be pinpoint accurate is what I am trying to say.
Weighting the seasons again doesn’t make much sense as we want to compare ‘apples with apples’ and see how they stack up against each other on their own merits. By doing this, we get a more rounded picture of what is likely to happen in the future, without any bias being placed on past performance.
For example, there is no point identifying an anomalous season and compensating for it. We want to see the effects of that season in all its ugliness as such a season could quite easily repeat itself in the new season we are analysing for.
I could write a book longer than the Bible with the amount of back-testing we have performed over the years, and the benefits of this are that we now split the seasons at their natural mid-season interval. The 2017 Summer League HDAFU tables started this trend and in a few weeks, when the Winter Leagues end in Europe, we will again be providing three tables for each league (the whole season analysis, first half split, and second half split).
Hope this helps and thanks again for contacting us!
One question though. How can I obtain Betfair ‘s odds from the data?
Thanks in advance.
Hi JVR,
We can work out roughly how an exchange would operate by increasing all the bookmaker odds by one tick.
This is fairly simple, and involves entering figures in the Odds Toggle and Commission Rate fields in the Data Tab.
Procedure:
Calculate the harmonic mean of each column of odds.
For example, the home odds are in column S beginning at row 10 and ending at row 484 (I’m using a random choice, Finland 1st Half season, as my example – of course, the last number will be different according to which table you’re looking at).
The harmonic mean formula for this range is =harmean(S10:S484)
Whatever result you get, in this case 2.27, you need to increase by one tick (or whatever you prefer). In this case to 2.28.
The percentage difference between 2.27 and 2.28 is 0.4405%. (2.28 minus 2.27 = 0.01, divided by 2.27, multiplied by 100).
Enter the outcome of your calculation in the Odds Toggle field for the bet type you are analysing.
Enter your usual Betfair commission rate in the Commission Rate field below the Odds Toggle figure.
Once you’ve done this, all figures in the spreadsheet for the home win will change automatically.
It’s not an exact science but it will give you an idea of the effects on the likely results of using an exchange.
Hope this helps!
Hello Right Winger,
i will quote a fragment of this article to formulate my question.
“As is typical of an underdog backing profile, the high risk/high return nature of this bet type produces a noisy curve, one full of jagged peaks and troughs. There are only small rising areas to analyse. Anything you can analyse into promising profits will contain few betting opportunities in a season, with long runs of losing bets to cope with.”
Looking at the underdog graph, i notice two particular areas that looks interesting. The first is from 4.59 to 5.40, with a potential profit of above 7000 units and 25 average bets to place. The second is from 6.50 to 8.50, with a potential profit of around 9000 units and 29 average bets to place. This particular points are rising with little to none statistical noise. But you mentioned that this segments carried only few betting opportunities and a risk of long losing streaks. Looking at your summer HDAFU campaign summary i see that you included 5 underdog systems with as little as 10 bets to place (and 20 on average). The maximum losing streak though is 10, and the only time you picked a high odds range was on the second half of the brazilian Serie A (odds from 6.50 to 8.22), with a losing streak of just 9 bets (i noticed that usually at these high odds the losing streaks are much higher, around 15 or so). So the reason why you didn’t consider the aforementioned systems in this article is because of the longer losing streaks? Did you analyzed it first and then realized the risk was not worth it? Is it safe to assume that when choosing higher odds system (higher risk and fewer bets) you try to keep the losing streak lower than you would usually do (for example here you chose the draws system with a maximum losing streak of 16, but lower odds/risk and more bets to place)? Let’s say i find a system with odds from 6.30 to 7.80, 20 games expected and 14 losing streak. Would you try to find something better and less risky?
Sorry for the long long question, but if you feel as much excited as i do when talking about betting (and i’m sure you do), i know you will not mind.
Thanks!
Right Winger,
the first system i mentioned in the Paraguayan League, after filtering it, shows a potential profit of 1515 units, maximum losing streak of 7, 5 seasons in profit, and every other value is excellent as well. 23 games expected. Can you explain why you didn’t consider it?
Hello again Daniele,
Some good points in your last two comments.
We chose the Paraguay league as our example, and as the free download table, because we thought that it would not be so popular when customers considered buying our HDAFU Tables. (In other words, we thought not many people would buy it anyway, so it would do as a ‘loss leader’).
To be honest, the time it took to write an article explaining how to use the tables to find systems was enormous.
Not only did we have to explain in minute detail every step of a process that has become second nature to us, we also had to include all the additional things to think about when analysing the tables rationally to find reasonable systems.
Paraguay is therefore a catch-all example. It does the job in illustrating the entire process. If there are other systems you have found that seem more appealing to you, then great – we’ve done our job to put you in a position to understand and find them.
Our primary intention was therefore to explain things as clearly as possible.
Every individual has his or her own level of risk aversion or acceptance. Personally speaking, I must admit that I am certainly not in a position to discuss how I decide what level of risk is acceptable to me. There are so many factors that are involved in this decision: time available to deal with the risk; starting bank size; revenue targets; staking plan; stop loss and ratchet mechanisms; when to bet; what to bet on…etc., etc…
I think what I am trying to say is that we’ve given you all the tools to make those decisions for yourself. I can’t give you my clothes to wear as you’re probably a different size and they won’t fit you as well as they do me. Hopefully this analogy is clear.
This is the reason why we don’t offer picks or sell definitive systems. It is impossible for us to know the individual needs of each and every customer. All we can do is supply everything on a plate for you to decide what is palatable to you personally.
I am at a loss to understand why people would ever subscribe to a picks service and play it blindly, not knowing how the picks are made, or what the likely long-term prospects are.
In contrast, our approach enables you, the customer, to stay in control at all times, which is one of the key foundation stones for successful gambling – staying in control.
Advocating this mindset is why Soccerwidow is so unique. 🙂
I hope this helps!
Hello Right Winger,
do you use every bookmaker available on Oddsportal when compiling the odds for the HDAFU tables? What should i do if i don’t have access to this bookmakers and my selection would be much more limited (with considerably lower odds)? Let’s say on a particular match the higher odd on Oddsportal for an outcome is 7.50. My highest odd available is 7.20 and my system tells me to play odds from 7.40. Should i use the Oddsportal reference (the same used for my analysis) and place the bet anyway, or should i skip this match? Wouldn’t the last option make me miss many betting opportunities, sabotaging completely the analysis and the system predictions? Should i just bet an odd even if it’s not in the range, if it is in the range on Oddsportal? Maybe using the odds toggle function to check my expected profits before choosing the system, to see if it is still profitable at lower and more realistic odds?
I hope my question is clear enough, and thanks in advance for your reply.
Hi Tony,
I think I’ve understood your various points.
Firstly, our Oddsportal bookmakers comprise the compulsory list of 16 (although these do tend to change regularly at the whim of Oddsportal), plus 16 of our own choosing:
188bet; 888Sport; Betclic; Betfred; BetVictor; Betway; BoyleSports; Comeon; Coral; Expekt; Island Casino; Ladbrokes; SBOBET; Sportingbet; Tipico; Titanbet
The historical odds we use are set in stone, so it really doesn’t matter if some of Oddsportal’s compulsory list interchange with others during the season we are betting on. Just set your optional pool of bookies to resemble ours.
You should always go with what Oddsportal tells you is the benchmark for that game. If your system says play odds from 7.40 to say 8.50, and Oddsportal’s highest odds show as 7.50, then this game is ripe for selection.
If you can only get 7.20 from your list of personal accounts, then you should still place the bet, but you’ll need to reassess as you go along whether you can get good enough odds all round to make your system worthwhile.
Check out our article on the Odds Toggle function of the HDAFU Tables, and also see my reply dated 6 May 2017 to JVR above.
If you are consistently experiencing such gulfs between best odds available in the market as a whole versus your own personal bookmaker portfolio, then keep tabs on the situation and measure its effects to save yourself from pursuing a no-win strategy.
Try out Vodds (featured halfway down the Eastbridge article) if you are struggling to get near best odds. You get access to Pinnacle there, so you should be near the top of the pile when it comes to obtaining best price…
Hope this helps!
Thanks for your answer Right Winger.
This question is just for personal curiosity, but would it be possible to base the HDAFU tables only on Pinnacle odds, for example? Would the analysis be reliable using only one bookmaker as benchmark? I’m not talking about the difficulty of isolating Pinnacle odds and inserting them in the tables, but just about the validity of the tables using only one bookmaker as a benchmark. If i understand correctly, since only the higher odds are used for each system this should not be a problem since is not a matter of averages. Also, i noticed that the oldest seasons tend to have less odds on oddsportal then the newest ones. So (i guess) this can alter the balance between each season, even slightly. Using only one bookmaker can fix this problem, even if maybe is not relevant like i think. I am very curious to hear your thoughts about the matter.