We decided not to remove this post from the site because of the many questions and answers in the comments section. For those of you with curious minds it may also be quite interesting to see how our HDAFU Tables have developed over the years.
Read about: The Power of the 7th Generation of The HDAFU Tables
Our HDAFU tables have evolved tremendously over the years. They are a complete statistical analysis of historical performance over the previous five seasons of the Home win, Draw, Away win, Favourite win and Underdog win (H-D-A-F-U). They serve to identify the most profitable odds ranges in each bet type.
To help you understand why we value this product so highly, here is our Definitive Guide for using the 5th Generation tables to their maximum potential.
It’s difficult for us to put into words how important the HDAFU tables are to us and our own betting adventures. But what we can say is that we have complete confidence in them to do their job. And from testing them in a live setting, we know that they are an extremely reliable method of building lucrative betting portfolios.
Quite simply, they are the best and most user-friendly tools available for nailing down value betting systems in every league you apply them to.
They reveal the DNA of a league, and provide a hidden level of detail that makes finding and exploiting the sweet spots so easy and so rewarding.
The next six steps will probably change the way you think about betting…
Step 1 – Observation
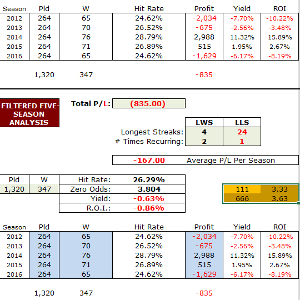
By default, the HDAFU tables open on the Data Tab showing the financial summary of each bet type. Here are the figures from an example league.
(Click on the image below to enlarge it in a new tab):

The totals along the top row show the effects of betting on every match over five seasons. In our example league the totals are (from left to right) Home win (-7,329), Draw (-835), Away win (+8,236), Favourites (-2,594), and Underdogs (+3,501).
You can see from this graphic that away wins look the most promising backing system with a profit of 8,236 units from 100 unit stakes.
To customise the stake amount enter what you want in the Fixed Stake box at the top of each bet type in the Data Tab.
The image above shows the full five season cold analysis. If you enter a different stake amount the financial values will change, but the percentages will always remain the same. This being the case, we have fixed these percentages as a benchmark to better gauge the improvements we will make with our filtering exercise later.
The Odds Toggle is for testing the effects of the odds you are getting when playing the systems for real – you can ignore it during your analysis.
You can also leave the betting exchange commission rate at zero. Again, use it for backing system monitoring purposes when you start betting on or paper testing your systems of choice.
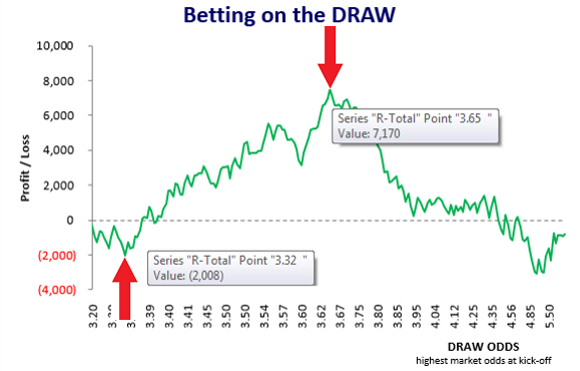
Okay, we fancy away wins in this particular league but let’s now have a look at the Inflection Points Tab to see if this backs-up our observation.
(Click on the image below to enlarge it in a new tab):

Away wins are certainly financially the most profitable bet type but the profit curve doesn’t really begin rising until odds of 3.30 are reached. Overall profit at this point is 463 units and this rises to a peak of 13,502 units around odds of 8.60.
These two points on the graph would therefore be our two inflection points: Odds of 3.30 where the curve begins to rise; Odds of 8.60 at the pinnacle, the point at which profits begin to fall again.
However, notice there is a big portion of the away wins curve which is a zero-sum game. This ‘hole’ in our profit curve begins around odds of 3.75 (6,653 units). At this point, the curve falls away again, encounters what we call ‘statistical noise’, and only recovers at odds of around 6.52, when the profit figure surmounts its previous high at 7,184.

In between these two points is the potential for a lot of wasted effort and not a lot of gain.
We can see the extent of this by scrolling down and looking at the inflection point intervals.
(Click on the right-hand image to enlarge it in a new tab):
This image shows the start of the 3.75 odds sector at the top and the end of the 6.52 odds sector at the bottom.
The yellow column indicates the running total of matches up to each cluster of matches.
We can see that our two odds of 3.75 and 6.52 encompass roughly 330 matches – the difference between 1,115 indicated at the 6.52 break-off point and 785 at the starting point of the 3.75 cluster.
That’s 330 bets over a five season period that are simply not worth making; or 66 bets in a season.

We can see this clearer by looking at the same snapshot between our original inflection points of 3.30 and 8.60.
:(Click on the left-hand image to enlarge it in a new tab)
In this odds range, we have roughly 587 bets (1,221 minus 634). We now know that more than 56% of these (330 bets) are not worthwhile making.
This leaves only 257 bets but the away win profit sectors between the inflection points seem to be split into two areas of the curve: from odds of 3.30 to 3.75 (medium risk system, accounting for around 160 bets), and then from odds of 6.52 to 8.60 (high risk system; around 100 bets).
If we were to continue our analysis of away wins we would eventually see that the three elements (the medium risk sweet spot, the high risk sweet spot, and the statistical noise in-between) combine to give us a bumpy ride.
Our expected hit-rate will be tempered by that area of noise, and yield will be lower because of the size of the zero-sum area and the number of pointless bets within it.
This means a lot of unpaid work to perform, placing many bets that maintain the status quo and not much else. On top of this, the losing streaks will be greater.
Therefore, why not split into two systems in this league?
The synergy we have mentioned before about many systems supporting each other is what makes the HDAFU betting systems so viable.
However, we also mentioned that you should find the single best system in a league to play alongside the other best systems in the other leagues within your portfolio.
In our away win example, we would need to choose the better of the two systems we have identified. Either backing away wins at odds between 3.30 and 3.75, or between 6.52 and 8.60. Choose one or the other, not both.
We recommend never to play multiple systems in the same bet type. The synergy effect is diminished as ultimately, one of the two systems is not the best we can find.
Ideally, we are looking for synergy between the absolute single best systems in each league within our portfolio, without creating a situation where one system supports another within an individual league.
With different bet types in the same league (e.g. 1×2 market and over/under goals market) this is not an issue, but we would go as far as avoiding the conflict of interest between HT and FT 1×2 systems in the same league, for example.
Away wins initially looked great but is there something better?
Have a look once again at the Inflection Points graphs to try and see what it is.
As is typical of an underdog backing profile, the high risk/high return nature of this bet type produces a noisy curve, one full of jagged peaks and troughs. There are only small rising areas to analyse. Anything you can analyse into promising profits will contain few betting opportunities in a season, with long runs of losing bets to cope with.
Backing the favourite has one area between odds of 1.90 and 2.10 but we can see at these odds not a huge profit is created over five seasons (less than 3,500 units).
The home win is a misery for backing. Again, the sweet spot is between 1.90 and 2.10 but the profit is less than 2,000 units.
That leaves us with backing the draw. There is a large, rising area in the curve beginning at draw odds of 3.32 (-2,008 units), and peaking at 3.65 (7,170 units). It represents a potential profit chunk of 9,178 units over five seasons.
This is better illustrated by superimposing our inflection points onto our graph – We are interested in only the portion of the curve in-between the red arrows:
The shape of this curve is what you should be looking for when identifying the first system to analyse in your leagues of choice.
It is the classic, gently rising curve from bottom left to top right. It is relatively smooth, with a far smaller amount of statistical noise.
Therefore, this is the bet type we will analyse as our example.
Next Page: Step 2 – Hiding, Sorting & Filtering


Hi,
When will the 2018-19 winter league tables be available for purchase?
Thanks.
Hi Simon,
our deadline is to publish the tables for the 2018-19 season the next two weeks.