Step 3 – Adjusting the Filtered Five Season Analysis Box
As mentioned before, we have fixed most of the figures in the summary box at the bottom of the draw bet type. (The box entitled ‘Full Five-Season Analysis Backing Draw in Every Match). These will provide you with a benchmark for comparing with our filtered analysis.

What we are going to do now is adjust the formulas in the box entitled ‘Filtered Five-Season Analysis’.
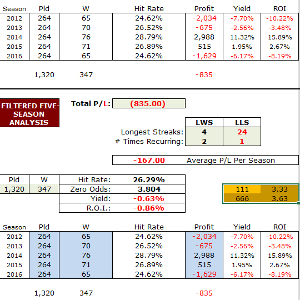
To make this easier, we type in the parameters of our new list as an aide-memoir.
All we need to remember is the start of the list on row 111 at 3.33, and the end on row 666 at 3.63.
The image on the left below shows where we have used a spare part of this box just to type in our parameters (where we have highlighted in orange).
The cells we now need to attend to are colour-coded, green and blue.
Firstly, the green cells: Total P/L; Longest Winning & Losing Streaks (LWS & LLS); # Times Recurring (for both); Pld (total number of bets); W (total number of winning bets). There are seven green cells in total.
Secondly, the blue cells showing the five season breakdown of matches played, bets won, and resulting profit. There are fifteen blue cells in total.
Adjusting the Formulas
We will do the green cells first.
Click on the first green cell, the Total P/L figure. In this example, cell AO1354, showing (835.00).

Look at the formula bar above it. (In this case above columns AO and AP). The formula looks like this:
=SUM(AN10:AN1329)
All you need to do is click inside this formula and change the numbers. Change the 10 to 111, and the 1329 to 666.
Check that all is okay before clicking on the tick to the left of the formula box.
Just change these two numbers in each formula every time.
Do these simple number substitutions in the remaining six green cells and repeat them for the blue cells.
Some of the blue cell formulas contain two sets of numbers. For example:
=SUMIFS(AN10:AN1329,F10:F1329,”2012″)
In these cases, you will need to change both 10’s to 111 and both 1329’s to 666.
For the more Excel experienced among you, the replace function may provide a small time saving (although you will have to unprotect the Data Tab before attempting this).
The very last step is to check each of the green and blue cells to ensure you have the correct numbers showing.
This is vital, please!
Step 4 – The Final Analysis
Having successfully performed the first three steps, our spreadsheet summary boxes should now look like this:
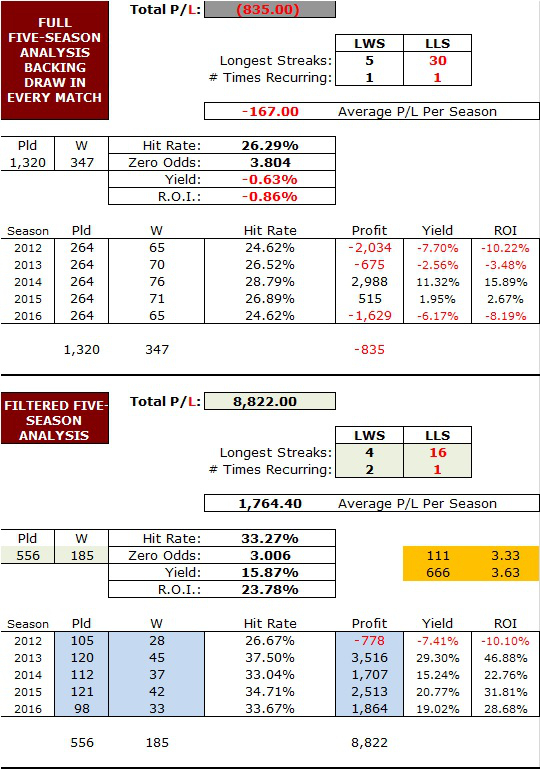
Wow! What a difference!
Having filtered out the sweet spot in this league, we are left with a very promising system.
The profit/loss figure has improved by over 9,500 units (8,822 + 835) simply by concentrating on where the inflection points graph told us to look.
We have increased the hit-rate from 26.29% to 33.27%, which has improved the zero odds for the draw from 3.804 to just 3.006.
If we are targeting draws between 3.33 and 3.63, every bet we make in the new season will therefore be a value bet!
This is another vital contributory factor towards the synergy of our portfolio.
The longest losing streak has been cut in half (16; down from 30), whilst the winning streak is now two separate occurrences of four rather than one set of five previously.
Yield looks pretty good too. With betting in general, anything around 5-6% is a good yield. With the HDAFU systems we employ, our minimum yield requirement is 10%. 15.87% is therefore very tasty indeed.
Some of the analyses we have carried out in the past have produced yield values in excess of 100%.
But despite all of this, does this analysis prove that this system is worthwhile pursuing?
Checklist for Betting System Acceptance
These are our personal criteria for making a betting system selection decision:
- Before accepting any system into our portfolio, we require that it has been in profit in at least four of the previous five seasons.
- The number of betting opportunities and the hit-rate should both show fairly consistent figures throughout the five seasons.
- Zero odds must preferably be below the filtered system’s first (lower) inflection point value. (This is of more importance to medium and high risk systems such as backing the draw, the away win, or the underdog).
- Yield must ideally be 10% or more.
- The maximum expected losing streak should preferably be no more than 20 matches, although higher risk systems will indicate longer streaks. It is up to you to find an acceptable balance depending on your own acceptance or aversion to risk.
- Average Profit/Loss Per Season should preferably be in four figures (when analysing with a 100 unit flat stake).
Next Page: Further Tips & Tricks and Step 5 – Identifying Risk


Hi,
When will the 2018-19 winter league tables be available for purchase?
Thanks.
Hi Simon,
our deadline is to publish the tables for the 2018-19 season the next two weeks.