After the first wave of the coronavirus, most of the leagues have now resumed their games and Soccerwidow started a public experiment to see whether old statistics can still be used and what can be observed after this unexpectedly long break.
Since the 1st of July, we have been running an HDAFU Tables experiment on Soccerwidow, and a parallel Over/Under Goal betting experiment on our German-language sister site Fussballwitwe.de.
Whilst it is too early to say whether the HDAFU Tables will perform to expectations, the Over/Under picks are doing outstandingly well. The original starting bank of 3,000 increased by over 50% in 25 betting days.
Slideshow Picks
The picks for the respective day appeared here around 1 p.m. (sometimes earlier) as well as the results of the previous day.
Please click on the arrows to scroll through the entire history of the picks.
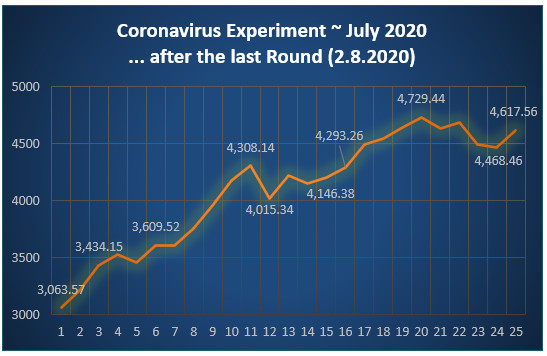
Below are all the picks that were published during the July 2020 Corona experiment (the 2019-20 Winter League seasons finished now). The bank grew from a starting point of 3,000.00 to impressive 4,617.56 during just one month. It was very pleasing to see that the statistics taught in the coursebook in combination with the Cluster Tables did so reliably well despite this Corona outbreak and very long breaks of the leagues.
[slideshow_deploy id=’6755′]
The expected probability and zero odds are calculated exactly as described in the coursebook using the Cluster Tables. The selection criteria is:
- if it has a minimum probability of 60%, and
- if it has a positive value, and if not,
- the bet with the lowest negative value in the 60% – 80% cluster is selected
- only 1 bet per match is selected
The basis for calculating the stakes is the following risk adjustment
- Odds up to 1.1: 5% from the bank
- Odds between 1.1 – 1.16: 4% from the bank
- Odds between 1.16 – 1.39: 3.8% from the bank
- Odds between 1.4 – 2.25: 2.5% from the bank
- Odds between 2.25 – 7.50: 1.5% from the bank
- Odds over 7.50: 0.5% from the bank
Stakes are always rounded to the nearest whole number.
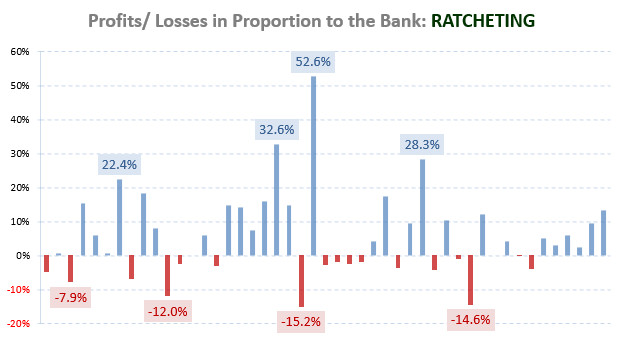
However, not only are the stakes calculated according to the risk but a ratchet system is also applied. This means that the stakes increase with each round in accordance with the highest bank total achieved and remain at the same level even if the bank then decreases again. The stakes are only reduced if the bank erodes to 60% of the starting bank (i.e. starting bank loses 40%).
Starting Bank (at the start of the experiment on July 1, 2020): 3,000
Highest Bank (25th July 2020): 4,729.44
Bank will increase each day if there are winnings; bank for calculating stakes will only reduce when it drops below 2837.66 (60% of starting bank).
Duration of the experiment
We all know that the coronavirus interrupted/paused the leagues for different lengths of time.
The EPL broke on March 9th and, after a 100-day break, started playing again on June 17th.
Italy also stopped on March 9th and started playing after a 103-day break on June 20th.
Poland suspended on March 13th; their break was only 81-days and they started playing again on May 29th. The league concluded on 19 July 2020 and all matches of 31–37 round have been played with “no more than 25 percent of the number of seats allocated to the public”.
Spain suspended on March 10th and started playing again since June 11th after a 93-day break. There were matches played nearly every day for 39 days – concluding on Sunday 19 July.
Each league will make up the lost time differently, however, the last game of this winter season is scheduled to be played on August 2nd. This will end our experiment. In summary, we are expecting from the 1st July until the close a total of 85 matches for cluster table betting.
Important information about the current risk!
Even if we trust our own coursebook and statistics and are actually pretty sure that the published picks will lead to a profit, we are currently playing safe by not risking real money on this experiment.
Just like everyone else at the moment, we can only guess what effect playing in empty stadiums will have on match results. Will home advantage be affected?
How do psychological factors affect results? Like all of us, the players were locked up in their houses for months and subjected to strict curfews.
Did everyone continue to train equally? What effect has this break on the fitness of the players?
There are currently so many questions and unknown factors that could potentially affect game results. Therefore, be careful! Should you follow our picks with real money, then please stake only as much as you can afford to lose and please adhere strictly to the staking plan!!!
Fingers crossed that things go our way! 🙂
Enjoy & share, Your Soccerwidow
Over Under Betting as of 15 July 2020 ~ 11 days Picks: 42 Games
Since the 1st of July, 42 matches have been evaluated and ‘live’ betting recommendations ahead of the games were published.
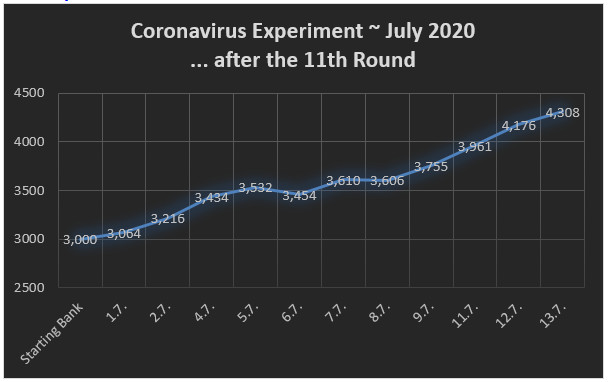
After 14-days into this trial what can be said is that, at the moment, it is debatable whether one can take past statistics and select bets based purely on mathematical formulas and calculations.
Here are our observations so far:-
People who bought the coursebook know about the recommended use of the Profitability/Yield quotient. Unfortunately, the quotient currently proves to be very volatile and using it for choosing bets may lead to losses.
Selecting by ‘value’ only is also backfiring at the moment. There is a clear trend of more goals than usual in the matches and bookmakers are adjusting their odds to reduce their payout risks. Hence, bets that look on paper like they contain ‘value’ are probably ‘valueless’.
Nevertheless, every cloud has a silver lining and, although the probabilities seem to have shifted a little, it seems that the 60% to 80% probability cluster has an especially higher hit rate than actually expected (i.e. mathematically speaking, using past statistics). If the expected Zero-odds are calculated using the Cluster Tables, it can be clearly observed that bookmakers are reacting to this current change by lowering their prices (betting odds).
Therefore, the current course of action suggested is to consciously search in this probability cluster (60% to 80%) and to include bets in the portfolio within this range that have a low or even negative ‘value’.
As you’ve seen in the above graph, with these conditions in place, the bank grew from 3,000 units to a respectable amount of 4,308 units in just 14-days…
Fingers crossed that these observations and conclusions are correct. We are only halfway through this experiment so time will tell.
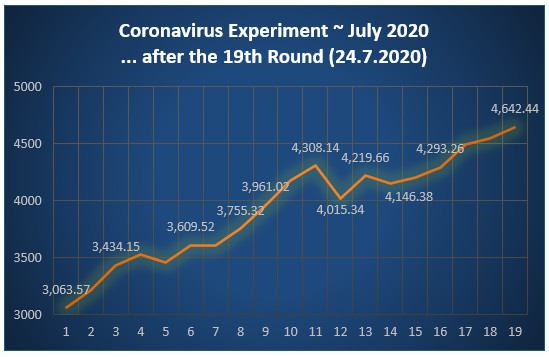
Report II as per 24th July 2020 ~ 19 days Picks: 67 Matches
The Coronavirus experiment is coming to its end and it can definitely be said that it is going very well indeed… So far, in just 19 days of betting, the bank has increased from a starting point of 3,000.00 to 4,642.44 units (54.7%).
I have been asked by some in the comments section below why I have been including not only positive values but also negative ones in the published picks.
The reason was that I wanted to give everyone the opportunity to see how and if statistics (and my coursebook) are still applicable both during the pandemic itself and when taking into consideration some pretty long lockdown suspensions/breaks of various leagues.
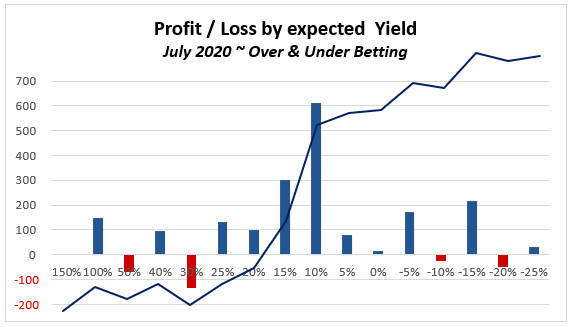
Below is a graph showing the profit curve applied to the Profitability/Yield quotients:
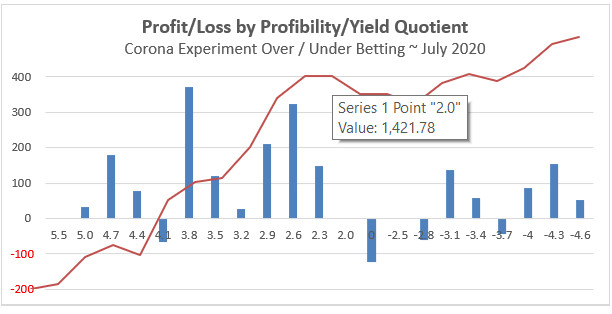
As you can see on the red curve the point 2.0 is the transition point (Profitability/Yield Quotient: 2.0). The profit up to this point is 1,421.78 (84.4% of a total of 1,684.04), achieved with 36 (of a total of 67) bets (53.7%).
The lesson therefore is… Past statistics are certainly still applicable and so are the teachings in my coursebook. Should you be using the Cluster Tables then it is prudent to choose the bet selections by applying the Profitability/Yield quotient (do not choose any bets below a P/Y quotient of 2.0!).
Nevertheless, for the public, I will continue to publish the picks until the end of this experiment using the same criteria (positive as well as a negative value), but from now on I will also publish the P/Y quotient with the picks.
Final Report as per 2nd August 2020 ~ 25 days Picks: 77 Matches
The bank grew from an initial figure of 3,000.00 units to an impressive total of 4,617.56 using ratcheted stakes (from a starting point of 100 units per bet) during the course of just one month.
It was very pleasing to see that the Cluster Tables performed so reliably well despite the coronavirus outbreak and the consequent very long pauses in our featured leagues.
Read the full reports and its findings here: Over Under Betting Experiment July 2020 ~ Final Report & Further Findings


Did you ever try backing under 0.5? Looks a large difference in zero odds and market odds, but obviously will be very high variance.
Hello again Andrew,
Yes, we’ve looked into the Under 0.5 market and it is always worth checking the 0-0 correct score odds if you fancy a dabble at this. The correct score market is in my opinion a more liquid market than Under 0.5, so you should find higher prices there.
As you say, 0-0 FT results account for just over 7% of all FT results, so you will find an awful lot of losers along the way, but if you can get the zero odds substantially bettered with every bet you make, and can stand the long losing streaks, then there is definitely mileage in riding the 0-0 wagon. Not for me though – you need a big bank and a thick skin if you want to turn a long-term profit here.
Well i’m used to high variance gambling in casinos using their bonuses, and from experience high variance = high long term profits if you keep going, but not sure if it’s going to be the same with this type of thing in terms of higher profits.
Any news on the summary of the experiment and the video tutorial? I was looking forward to reading that.
Hi Peter, I’m working on it. It will be hopefully published by the end of this week.
One other thing I don’t quite understand, you say on this site: “HO: home odds
AO: away odds
By dividing HO by AO we get a quotient which can be used for clustering matches by the ‘strength’ of the teams playing each other.
For example, if there is a match with ‘equally’ strong teams then the HO/AO quotient will be around 1.0 (more or less, roughly speaking); like a game Hertha Berlin vs. Stuttgart in 2015.
Hertha’s home odds were: 2.62, and Stuttgart’s away odds: 2.91.
HO/AO: 2.62 / 2.91 = 0.900
When clustering we are not asking the question; ‘Were these teams really equally matched?’ We don’t try to recalculate the 1×2 odds, instead we simply use the market prices and naturally assume that the market was at the time reflecting public opinion.”
But you also say the over/under odds are influenced by public opinion and thusly can be incorrect, but why is it then ok for the Home and Away odds which can also seemingly be incorrect due to public opinion to be used in order to calculate more accurate overs/unders odds?
I don’t see how that is logically consistent.
Hi Andy,
here are a few articles that address the HO/AO quotient. You will probably find some answers to your question there:
Over/Under Goals Market – Betting with Cluster Tables
Finding a System Using the HO/AO Quotient
It should be absolutely clear to everyone that odds are influenced by demand (public opinion) and so the Over/Under odds too. Less obvious is that there is a correlation between the HO/AO quotient and O/U odds and unfortunately, that is something I cannot refer you to any article to read about and I haven’t addressed it in the coursebook either. The explanations go far beyond the common apprehension of maths and statistics and are certainly interesting for a few readers but not for the majority of our readership. I’m sorry!
So about your latest update about the P/Y quotient – I have also been reading the “How to Use Soccerwidow’s Over/Under Betting Cluster Tables”.
I was basically using it as a shortcut to try and get the minimum amount of knowledge to use your cluster tables successfully.
It does not mention the P/Y quotient in this article.
So it would seem the instructions in this article are not really enough to expect to make a profit without also considering the P/Y quotient?
Are there any other things I need to consider other than if the available odds are longer than the zero odds and also the P/Y quotient?
Hi Andy, please go to coursebook page 131. I encourage the reader there to experiment a little with choosing you bets by expected Yield only, or by expected Profitability only, or by the quotient, sticking to one probability group or one bet type.
Every person needs to find the selection type they personally prefer and that seems most reliable to them (however, please note that it may even vary depending on the league you play).
With calculating the Zero odds you know the true probability of the bet and then you can compare it to the market prices. However, even short prices may contain value to the punter if you use these bets to balance your portfolio.
I think people here would like to make a profit. But there is no real reasoning as to why the 60%-80% range should be more profitable than any other.
For the following im assuming in the last chart the negative quotient numbers are just to show which bets had a negative value right? Because negative/negative would still equal a positive quotient. (So if im right the chart shows that positive values returned a profit while negativ values didnt?)
Ok, so the Profitability/Yield quotient is basically just another way to express the probability. So sorting a sample by the quotient and sorting a sample by probability is the same. So a Quotient of 2 equals 50% probability. Bets below 50% would lose more often naturally. So maybe it was just unlucky that in this sample more bets from 50% won. From the bets between +2.00 to 0.00 there was a -50€ reduction. From +4.7 to +4.4 it looks like a -20€ reduction. This doesnt look much worse considering the probability of below 50%. So is there a reason you are ruling out the <2.00?
Hi Arnold, the 60%-80% range has been chosen because the losing streaks are not so long and the odds are in the region of 1.50-1.60 what allows a bank that is displayed publicly to rising impressively and easy on the nerves. Nevertheless, the other probability clusters also produce profits but not as remarkable.
You are right: a negative Profitability divided by a negative Yield equals a positive quotient. What I do is to add a ‘minus’ to these quotients to know that they have been calculated using negative P and Y.
To your last question… there haven’t been enough matches yet to draw unambiguous conclusions but it seems that the expected Yield can be between -15% and +25% without causing too much harm to the picks and the expected profitability should be ideally between 10% and 80%. However, for the probability cluster 60% to 80% it’s the P/Y quotient that seems to matter most.
But there is still one thing i dont get.
In your course you say two things when talking about choosing your bets.
At step 3 your say you usually prefer bets above 50% probability
and a few pages later at step 4 you say you tend to choose Value I/Value II Quotients above 3.00.
However, a 50% true odd calculation would equal a 2.00 quotient. A 3.00 quotient equals a 66.67%. The same with this article (min. 60%, quotient >2.00)
You are making it look like the zero probability and the quotient are two different or independent things. Both are the same, the value determined by the market odds does not change the quotient. So what is the reason for introducing the quotient. By saying odds between 60% and 80% you are basically saying a quotient between 2.50 and 5.00.
I probably haven’t made myself clear enough in the coursebook about the P/Y quotient. Sorry for any confusion. Here’s some additional explanation…
Firstly, yes, I prefer betting over 50% probabilities as this is easier on the nerves. This test addresses the probability range 60% to 80% (true probability, not the bookmaker odds).
To your second question about the quotient… What you seem to be referring to in your comment are the odds (prices of the bets), not the P/Y quotient. Yes, that is correct: a probability of 50% converts in odds of 2.00, probabilities 60% and 80% are converting into Zero odds of 2.50 to 5.00.
However, what I’m talking about are not the Zero odds but the Profitability (Value I)/Yield (Value II) quotient (coursebook page 127). And yes, you spotted it correctly: I’m recommending in the coursebook a quotient above 3.0. However, I have been doing some more research since I published that coursebook in 2015 and a P/Y quotient of 2.0 can be used as the minimum point when choosing bets.
Here’s an example calculation from the picks yesterday… AS Roma vs Fiorentina
Under 3.5 goals (probabilities for the teams taken from the Cluster Tables, HO/AO quotient: 0.3036)
AS Roma: 65.3%
Fiorentina: 62.5%
Zero probability: 63.9%
Zero odds: 1.56
Market Odds: 1.72
Profitability: 29%
Yield: 10%
P/Y quotient: 2.9
How to calculate probability and Yield, please refer to the coursebook pages 81 ff.
I hope this clarifies your question… 🙂
Nah, you didnt get what i mean, let me make it clear.
The following statement does not make sense: “For Person A to choose a bet, the calculated zero odds have to be above 1.75 and the calculated probability has to be lower than 65%.”
These criterias do not contradict each other but they refer to the same unit, since the probability is just a converted odd (1/odd=probability). Even though he says only bets below 65% calculated probability, he will never play a bet ranging from 65% to 58%. Because the 1.75 (57%) is the stricter criteria.
He could have just said odds above 1.75…
And the same goes for your V1/V2-Quotient:
So your formula for Value 1 (if a = Market odd, and b = Zero odd) is this:
((a-1)/(b-1))-1
your formula for Value 2 is:
(a/b)-1
Your formula for the quotient is:
Value 1/Value 2, and therefore:
(((a-1)/(b-1))-1)/((a/b)-1)
If you alternate this formula its the same as:
b/(b-1)….. use WolframAlpha or similar for a quick check.
So the only variable that makes up the quotient is the calculated probability (or Zero odd). This means the quotient doesnt hold any valuable information,it is just another way of expressing the probability. Just take all the bets you have ever made with this and sort them by the quotient, then take them again and sort by Zero Odds. It will be exactly the same order.
A calculated zero odd of 1.65 will always have Value1/Value2 quotient of 2.79, no matter the market odd. So when you are saying:
For this test im choosing a minimum probability of 60%…. and the V1/V2 quotient has to be higher than 2.00 your basically saying the following:
For this test im choosing a minimum V1/V2 quotient of 2.50…. and the V1/V2 quotient has to be higher than 2.00
So id doesnt make sense to even talk about this quotient when its just a fancy way to look at the calculated probability
Where did you get that statement form?
“For Person A to choose a bet, the calculated zero odds have to be above 1.75 and the calculated probability has to be lower than 65%.”
Let’s take it from there… and… may I suggest that we move over to Frequently Asked Questions – Fundamentals of Sports Betting Course as this discussion is now getting out of topic.
We’ll get it clarified but I need first to understand your question entirely and correctly.
Speak soon,
Elena
If this P/Y quotient is not at a certain value, then does it make the difference between success and failure? Only asking because I completely ignored this quotient when I first tried this method as I don’t remember being told it has the ability to cause either long term profits or long term losses (if it indeed does do).
Hi Andy, Arnold’s got a point. This quotient isn’t really necessary. You better chose your bets by expected Yield (anything between 10% & 25%) and/or Profitability (10% to 80%). I will write about it once the Corona experiment is finished, what will be this weekend, Sunday.
Rule of thumb: Chose bets over 50% probability to win that have a positive ‘value’ but not too large a ‘value’ as they have a tendency to become losing bets.
Example today: Torino vs AS Roma Under 2.5 goals ~ Profitability 195%, Yield 70%. Although this bet has a mathematical probability of 64% of winning, I consider it as being a true gambling bet because of the very high price difference between the Zero odds and the market odds. Either the market is following very strongly the public opinion who believes that this will be a high scoring game or the bookmakers have factored in something that isn’t covered by statistics.
Impressed with this trial and have often flirted with the idea of buying the course book and the cluster tables but worried that the maths will be too hard to conquer and I shall get frustrated with myself. Have you not considered offering this kind of service to subscribers who feel the same? I think it would be popular.
Hi Peter, I have always been pursuing the DIY approach because I cannot guarantee how long I will be able to keep up a subscription service reliably running. You know, Soccerwidow isn’t my main job. It’s just that right now, with this virus, I have plenty of time on my hands (like many others too) as I currently cannot travel abroad to do my work. Therefore, the good news is for people like you, yes, I am considering to extend this trial to one year and offer a subscription service during this time.
However, you don’t need to be afraid to buy the coursebook and work through it. The maths aren’t as complicated as they may appear on their first glance. Yes, it will take some time to master it but once you understand how odds are calculated and how bookmakers set their prices, you need per match not more than 3 minutes to identify the bet(s) worthwhile playing. And the good thing is… You will never ever depend on any subscription service anymore.
When you say positive or negative value does negative mean shorter odds than the zero odds, and positive mean longer than the zero odds?
A positive value means the market odds are higher than the Zero odds; a negative value is when the odds are shorter.
You can actually calculate the expected Yield and Profitability just by knowing the market odds and Zero odds. Do you have the coursebook? You’ll find the calculations, examples and exercises on pages 82 ff.
I see thanks, that clears it up for me why you seemed to be taking odds shorter than the zero odds on some of your bets.
Yes I do have the coursebook.
Although I can understand why bookmakers would sometimes have to offer generous odds on the 1X2 market by reading your HDAFU articles, I still struggle to understand why they would do it on the O/U market when reading about your other articles.
Hi Andrew, what I am doing on Soccerwidow is to make a point that simply applying past statistics and carrying out a few calculations is enough to predict future outcomes with pretty good accuracy. That is exactly what bookmakers do too; I don’t and neither do they have a Christalball. That is one point.
The second point is that bookmakers do betting as their profession and need to ensure that they make money with it. That means when offering odds (doesn’t matter which market; 1×2 betting, Over/Under betting, and so on) they will always follow the public opinion (offer and demand) and reduce odds/prices for bets when the demand is high and increase them when the demand is low. However, this doesn’t change the statistics and the likelihood (probability) of the bet.
Are you also doing the standard deviation bit as well?
For the picks in this article, I use the Cluster Tables and chose a bet in the 60% to 80% probability cluster. If there is more than one to chose from then I chose the bet closest to 60%.
It is an experiment and I am checking if past statistics (Cluster Tables) are still useful to predict the outcome of a future match and especially, how accurate the prediction will be. I currently don’t pay any attention if the price (odds) contains any ‘value’ or not.
Well this looks quite interesting but unfortunately I gave up on trying to find my own bets as I got very bad results, and I am almost certain I was doing everything correctly. But i’m known to have a low tolerance if I don’t get fairly fast results, so I’m not saying you work is wrong.
Another thing is that you seemed to be saying that exchanges follow bookmakers but in my experience its the other way around.
Might you ever bring out a software to highlight all the value bets for us?
Hi Andrew,
we are not saying that exchanges follow bookmakers. What we say is that bookmakers follow public opinion and that is probably reflected in the exchanges best. So, therefore, you probably can say, as you say, that bookmakers follow exchanges.
The software is something we are occasionally thinking about but then, other jobs pop up, and… we are off in another direction. Sorry!
Sorry but this is very weird. The O/U Test on the german website had a loss of around 60 (3000 to 2940). Not 4000 like in the picture above. Everything after that is just polishing by looking at patterns where none are.
So you are basically picking bets randomly (“It does not matter if the calculations have value or not”), so why even do calculations the first place) and secondly, which is even more important: Your are ruling out bets in hindsight. You had an unprofitable betting record and looked how to improve it. The answer seems to be the 60-80% Range. Give me a betting record of 500 with a -2% yield and im sure i can find some correlations that turn it into 10%. Is there causation? no, of course not… and what makes it worse is that everything is based on only 50 games. Thats all variance. Maybe 500 or 1000 matches can give us an idea.
Here some articles why data mining/dredging is not necessarily the greatest, even with a meaningful amount of matches:
https://www.pinnacle.com/en/betting-articles/educational/data-mining-in-sports-betting/4FC29M3VJY59Y4Q3
https://www.bettinggods.com/why-data-mining-doesnt-work-in-sports-betting/
Hi Arnold,
I have been running the test (picking 2 bets each match, paying attention to the Profitability/Yield quotient but not concentrating on one probability group only, always searching for the best value) that I published on Fussballwitwe together with 3 other (unpublished) tests at the same time, since the 1st of July. It’s just that I didn’t have the time to publicly display them on Fussballwitwe. Apologies for the confusion but it’s a lot of work to do so.
You are totally right about the variance… The graph in the article shows a bank development for 42 matches of which only 5 bets lost; that means a hit rate of 89.5%, far above expectations! Too good to be true!
From yesterday’s 6 picks 3 lost. That brings us up to 48 matches in total with 8 losses and the hit rate down to 85.7%. That’s more realistic but still not within the expected probability cluster group. I probably should have pointed that better out in the article, that we are expecting a few losses due to uneven distribution.
Since the start of the experiment, an article on Soccerwidow was planned as well, but unfortunately never written. Of course, as I finally found the time to write it I chose the most successful test. Nevertheless, the Betting on Over 0.5 goals and Under 5.5 goals also shows very nice positive results as you can see…
For those who wish to read the German article: Fussballwitwe I there described the shift of thinking step by step.