
The Fundamentals of Sports Betting Course has long since been Soccerwidow’s flagship product. It is the most comprehensive guide available anywhere explaining the mysteries of bookmaker mathematics and how to profit from understanding the concept of ‘value’.
In conjunction with the course and based on its teachings, Soccerwidow also publishes a set of dedicated Over/Under Goals Cluster Tables (summer and winter leagues), which are a one-touch solution to identifying value within the over/under ‘X’ goals market for individual matches in a particular league.
What is a Cluster Table?
A Cluster Table is an Excel spreadsheet containing an interactive data set, which displays goal distributions in a particular league during the five complete seasons immediately prior to the season currently in play.
Results are split into four equal-sized groups, or ‘clusters’, according to the historical home and away odds of each match within the five-season-data-set (highest odds at close of ante post market), which act as a gauge of public opinion (perceived strength of the teams), for the match under consideration.
Here are two cluster examples taken from a game in the English Premier League (EPL) during the 2017-18 season. The screenshots come directly from the EPL 2012-17 Cluster Table.
Click on the images below to enlarge them in new tabs:
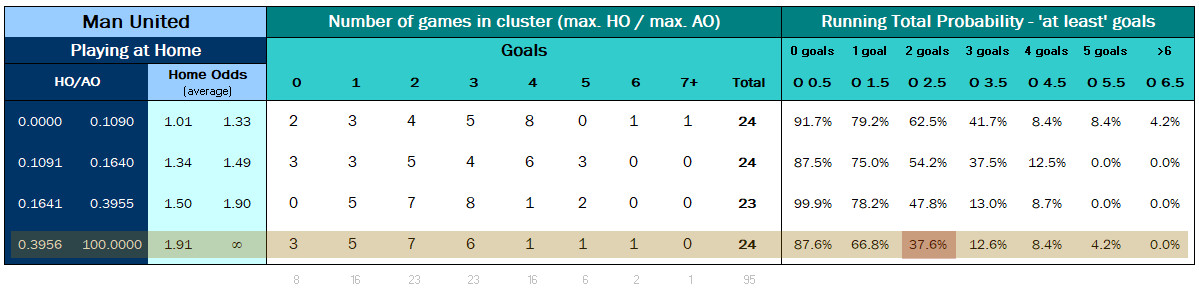
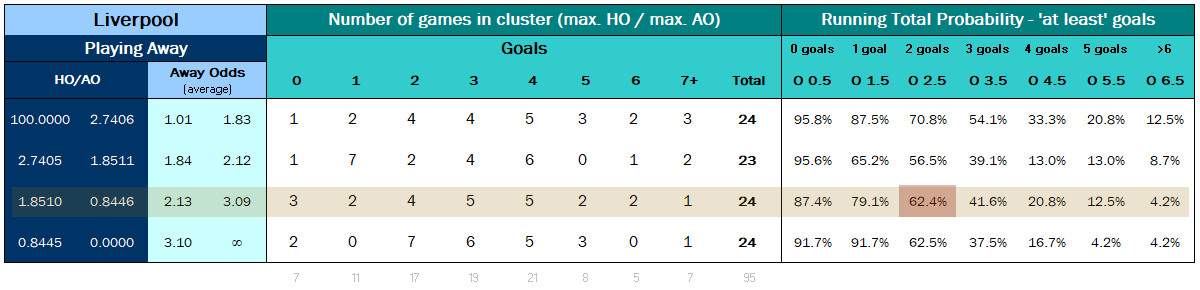
As you can see, the four clusters representing 95 respective home and away games over five seasons are divided into almost equal sets (3x 24 games; 1x 23 games), which determines the division of their HO/AO quotients (Home Odds divided by Away Odds).
Two rows are highlighted: these are the corresponding rows for the match between these two teams on 10th March, 2018.
The home odds of Manchester United were 3.30. Liverpool’s away odds were 2.61. The HO/AO quotient was therefore 1.26 (3.30 divided by 2.61).
How to Interpret the HO/AO Figures
The HO/AO clusters for all teams are different from one another. But why?
Odds are determined according to a team’s historical (statistical) strength (success), or lack of it, and no two teams perform exactly the same, which will of course produce different quotient figures.
How then is it possible to compare two teams in this fashion?
The home odds and the away odds are set by the bookmakers according to historical distributions (statistical results) and therefore provide a constant benchmark to a team’s past performance (looking backwards).
By the time the ante post market closes, they also contain a deal of public perception in terms of demand for the bet in question (looking forwards).
Therefore, the HO/AO clusters take the correlation between the ‘perceived’ strength of the teams involved (based on historical results) AND the market pressures (demand and supply) faced by the bookmakers when setting their odds.
The HO/AO quotient is therefore an ideal method of comparing two teams by selecting from their historical results the nearest batch of equivalent games against teams of a similar perceived strength to the opponent under analysis.
If United are 3.30 to beat Liverpool and Liverpool are 2.61 to beat United, it makes sense to look at comparable results where both teams carried similar prices in their respective home and away games in the past (i.e. the closest United home games to their price of 3.30 in this game, and the closest Liverpool away games to their price of 2.61).
Splitting five seasons’ worth of games into four clusters does not divide exactly. Each team plays 19 games at home and 19 away per season. This makes a total of 95 home and 95 away games for each team, hence why for United’s home games and Liverpool’s away games (and any other team) there are three clusters of 24 games grouped together, and one cluster of 23.
In our example, it is coincidental that the most relevant clusters for both teams to the calculated HO/AO quotient of 1.26 each contain 24 games over the last five seasons.
What the Clusters say about the Comparative Strength of Teams
When looking at the tables in the EPL for any team, the following categories become apparent when dividing games into ‘perceived strength’:
- HO/AO: up to 0.2248
The home team is the clear favourite with a very good chance of winning (the weight of money makes the home team the overwhelming favourite) - HO/AO: 0.2249 to 0.4902
The home team is definitely stronger than the away team, but there is also a good chance of a draw in the game (fluctuating opinion between home or draw) - HO/AO: 0.4903 to 0.7730
It is not really clear in which direction the game will develop (no overwhelming favourite) - HO/AO: 0.7731 to 1.6922
The chance of a draw is quite high as both teams are perceived to be of equal strength (no overwhelming favourite) - HO/AO: over 1.6923
The home team is weaker than the away team; it could be an away win (the perceived favourite is the away team)
Why are ‘Zero’ odds important?
After the setting and publishing of opening odds for sale, the price of a bet is then influenced by:
- The popularity for that bet amongst punters (demand)
- A balancing act of monies received between the outcomes carried out by the bookmaker via price fluctuations to create its margin/profit (supply)
The price fluctuations (changes in the odds) from the opening of the market right up until the end of the event are therefore driven by both demand (punters) and supply (bookmakers), and contrary to popular belief, not dictated solely by the bookmaker.
If the zero odds of an event are known it is possible to identify temporary or lasting pricing ‘errors’, large and small, caused by these fluctuations in demand and supply. These errors can then be used to ensure that every bet placed contains ‘value’, the essential element in making long-term profits from gambling.
As a reminder:
- Prices offered above zero odds represent value back bet opportunities
- Prices offered below zero odds represent value lay bet opportunities
Zero odds are those at which, if every bet were placed at this price, the overall outcome of any number of bets would be a ‘zero’ sum game.
Finding ‘value’ is therefore about determining the implied (actual estimated) probability of an event (based on historical results), and obtaining odds representing a lower probability (i.e. higher odds) if backing, or a higher probability (lower odds) if laying.
Of course, the higher the odds obtained above zero odds are, the more profitable your long-term back bet portfolio should be and the lower the odds obtained below zero odds are, the more profitable your long-term lay bet portfolio should be.
Manchester United vs. Liverpool
The HO/AO quotient was 1.26, suggesting that public perception of the event was that the draw was probably the most likely outcome.
In the images above, the Over 2.5 Goals bet type is highlighted.
HO/AO 1.26 sits in the fourth cluster of United’s cluster table, and the percentage chance of Over 2.5 Goals for their home games within this cluster was 37.60%
HO/AO 1.26 sits in the third cluster of Liverpool’s cluster table, and the percentage chance of Over 2.5 Goals for their away games within this cluster was 62.40%
Calculate the average of these percentages: 37.60% + 62.40% = 100.00% / 2 = 50.00%
Calculate the zero odds: 1 / 50.00% = 2.00
It just so happens that the highest Over 2.5 Goals odds on offer for this event were also 2.00, providing no value in backing or laying.
The result was 2-1 to United, meaning that public perception of the event most likely being a draw was proved to be wrong. Public perception of likely outcomes and the eventual reality are very difficult to reconcile, which is why odds movements should never be relied upon as a guide to potential outcomes.
You should also note that the most popular games to bet on are usually those most intensely analysed (United vs. Liverpool is just about the most high-profile club game in the world). Because of this, the highest pre-match odds available for many of the different bet types are usually very accurate compared to the statistical likelihoods. In this case, we calculated 2.00 as the zero odds and indeed, 2.00 was the highest pre-match price available.
Once again, we reiterate just how accurate the Cluster Tables are in calculating probabilities.
Try the Power of the Cluster Tables for Only £2
The Cluster Tables are an extremely powerful tool for checking market odds against ‘true’ odds in order to select bets containing ‘value’ for long-term profit.
The tables can also be utilised for predicting odds movements before kick-off and much, much more, but we will write about these benefits in other articles.
A German reader once commented that he couldn’t believe we were selling the Cluster Tables because to him, “these five season tables are something like a ‘money printing machine’!“.
If you wish to play around with the table used in our example above, you can purchase the EPL Cluster Table for the 2017-18 season here for just £2:
This table comes with the added bonus of a £5 discount voucher applicable to the Fundamentals of Sports Betting Course – Over/Under Goals.
You can use this table for backtesting the 2017-18 EPL season. Randomly select any weekend and carry out the calculations as demonstrated in this article. Try experimenting a little and perhaps compile different portfolios such as:
- Choosing only Under 3.5 Goal bets
- Choosing bets which have at least a 60% probability to win
- Choosing bets with a strong home favourite only
- … and so on! Use your wits and imagination to find a system that actually works for you!
Once you understand how the Cluster Tables work and have found a system to focus on, picking bets for a weekend becomes truly very easy!
Please note that after the 2017-18 EPL season finishes this sample table will expire and should not be relied upon for betting purposes after that. Sorry, you will have to buy the 2018-19 replacement table. However, the 2017-18 version will certainly give you a good idea of the table’s full functionality.
If you have any further questions on how to use the cluster tables, please use the comments section below.
Thanks for reading and good luck with your value betting!


Hi,
I am doing some research on this subject. Do you have any reference to the maths used in these methods? Regards
Hi Thomas, the maths behind it is an analysis of the past distribution to predict the future distribution. Here’s a preview of my coursebook that includes the table of contents. It should give you a very good idea about the maths behind the cluster tables. Best wishes, Soccerwidow
Dear Soccerwidow,
I am making some back testing using the cluster tables you sent me when I bought your (fantastic) book. I have a question about the time when the data have been gathered, in particular in your prior notes you say that odds for the week end are taken on friday before while odds for mid week are taken on monday. For the matches of Friday and Monday evening which odds do I have to use? Furthermore, football-data web site says that odds for mid week are taken on Tuesday, is it incorrect?
Thank you and best regards.
Hi Giampietro,
Thank you for taking the time and trouble to contact us and also for your kind words about the Soccerwidow Odds Calculation Course.
Yes, it looks from Football-data’s notes that they do now collect midweek odds data on a Tuesday, which would apply for games played on Tue/Wed/Thu only.
For clarification purposes, this change won’t make any difference to the efficacy of the tables. The relationship between the home and away odds doesn’t change much through the whole ante-post (pre-kick-off) market period because the draw odds are used as the pivot to balance the book.
You will find that if home odds change, a simultaneous proportionate change will be noticed in the away odds, which will change the HO/AO quotient (home odds divided by away odds), but because of the wide margins covered by each cluster, it is rare that a shift in the quotient result will actually mean that the match in question moves to a different cluster.
We do mention in various sections of the blog relating to the Cluster Tables that results seen close to the margins of two clusters should be monitored until kick-off or even avoided altogether to prevent uncertainty.
Of course, ultimately, if you experience matches skewed into different cluster groups by moving odds as time elapses closer to kick-off, you can back out of the bets. Alternatively, just accept that some of these ‘misplaced’ wagers will win and some will lose. In the long-run, any anomalies will tend to even themselves out and should not affect the overall result detrimentally.
I hope this all makes sense and thanks for the question.
Best regards and happy hunting!
Thanks for the reply.
I hope I will explain my quey better now by this I meant,
How do you calculate this margins
Using your example the match between Manchester and Liverpool
Manchester.
0.000-0.1090
0.1091-0.1640
0.1641-0.3955
0.3956-100.00
Liverpool
100.00-2.7406
2.7405-1.8511
1.8510-0.8446
0.8445-0.0000
How do you calculate this margins or what mathematical approach do you use. Because I can see they are different for each team?
Thank you and kind regards.
Hi James, behind the bookmakers’ businesses and them calculating their odds for reliable success and the Cluster Tables (that have been developed with the view of helping the punter to find an edge) stands a sound mathematical/statistical concept but unfortunately, it is impossible to understand it without working through our comprehensive course book. Nevertheless, I will try to answer your question although it is not unlikely to raise more questions.
Firstly, you need to understand the concept of the HO/AO quotient: It’s putting the match into comparative perspective with past games. For the match Man Utd vs. Liverpool the HO/AO quotient was 1.26, suggesting that public perception of the event was that the draw was probably the most likely outcome. The home odds of Manchester United were 3.30. Liverpool’s away odds were 2.61.
Secondly, the cluster groups… Man Utd, playing at home, had in the previous five years not many games being priced as high as in this particular example. They are normally priced as the favourites at home, pricing the away team as the underdog. Hence, this match grouped in the last cluster (0.3956-100.00); Liverpool on the other hand was in 50% of the matches from the past five years the favourite when playing away. The match in the article therefore belonged into the third cluster group (1.8510-0.8446).
The grouping itself is simply done by splitting the past 95 games into four equally sized clusters, distinguishing between teams playing at home and teams playing away. Using the HO/AO quotient is the easiest way to compare upcoming matches with past results. You have teams that are usually the favourite at home (like Man Utd in this example) and sometimes they are playing a team that is equally strong when they are playing away (e.g. Liverpool). Other times the away team isn’t as strong.
Read a little bit more about the quotient and it’s use here: Finding a System Using the HO/AO Quotient Although this isn’t an article related to the Cluster Tables but is extends on the HO/AO explanations. So it may help you to understand the concept.
My query is how do you calculate the range for the cluster table for each team?
Hi James, I don’t know if I understood you question right but I will try…
The matches of each team are split in four (more or less) equally sized groups.