
This article moves away from betting on individual teams, and pushes strategic thinking further up the knowledge ladder.
The method described below explains how to use our HDA simulation tables for recognising profitable 1×2 betting strategies and building a portfolio from a selection of major European leagues.

Profitable betting on football is about compiling successful portfolios and understanding the underlying market economics.
The following analysis portrays just one successful scheme in detail – Have fun learning about market behaviour and deriving a betting system from it! 🙂
Understanding the Betting Market
It is impossible to predict with total accuracy the outcome of one particular match; however, it is possible to identify and use historical distributions of data to judge the future in general.
If you do not know what the term ‘distribution’ means, check out this article for an introduction:
Goal Distribution Comparison – EPL, Bundesliga, Ligue 1, Eredivisie
However, understanding distributions, odds calculation and probabilities is only the first step.
The next step is to understand the market economics. Just in case you missed them here are two articles describing how the bookmaker market works:-
How do Bookmakers Tick? How & Why do They Set Their Odds as They do?
How Bookmakers’ Odds Match Public Opinion
The main message of these two articles:
- Bookmakers set odds based on a mixture of statistical probabilities and public opinion. Effectively, their odds match public opinion.
- Bookmakers do not speculate (gamble). Their priority is balancing the books.
Comprehending Market Economics to Elect a Strategy to Investigate Further
Remember your basic economics lessons in school or college which were about supply and demand.
Adapt this to the football betting market: In which situations will bookmakers reduce their prices (odds), and which prices will increase as a result? Which bets are traditionally the most popular?
The fact is the majority of punters prefer betting on favourites up to odds of 2.5. Just look at online odds comparison sites which show the percentage distribution of bets on a certain outcome. It is frequently above 60% on the favourite (independent from the offered odds), if not higher.
On the other hand, consumer demand for bets on the underdog is often much lower than the actual chance of it winning.
Bookmakers are aware of this market behaviour and try their best to predict trends, time the market, and choose the best outlets for their odds. Customer behaviour is well analysed and used to generate various marketing strategies aimed at balancing the books and boosting sales.
Therefore, for the bettor, it is safe to assume that many favourites will be under-priced to win, and draws and/or away wins will be over-priced to “make up and balance the book”.
For example, a traditionally strong team like Bayern Munich playing away will, of course, attract a good deal of punters betting on them to win rather than any weaker opponent playing at home. However, most punters are normally ignorant of the fact that even teams such as the mighty Bayern Munich win approximately just 50% of their away games.
In these game constellations bookmakers, simply by following market economics, have to reduce their prices for the (away) favourites massively and balance this by increasing the price of the less fancied home team.
Investigating Distributions: Profit/Loss Inflection Points
From what has been explained in the previous chapter it should now be obvious that favourites are often under-priced to win, and draws and/or away are frequently over-priced. Therefore, it should be possible to find a workable strategy using this knowledge.
Now comes some maths… hang in there! 🙂
In the last five seasons, a total of 1,900 matches were played in the English Premier League (EPL), of which, 46.74% finished in a home win:
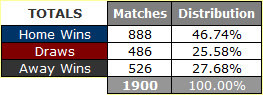 EPL: Full-time 1×2 distribution – Five seasons 2009-14
The home team was priced the favourite in 1,351 of these matches (home odds lower than the away odds), and a total of 763 games did indeed end in a home win, equating to 56.48%.
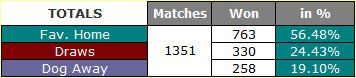 EPL: Favourite home wins – Five seasons 2009-14
The balance of 549 matches saw the home team priced as the underdog (home odds higher than the away odds). From these games, 125 finished in a home win for the underdog, equating to 22.77%.
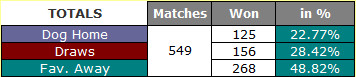 EPL: Underdog home wins – Five seasons 2009-14
Now convert these favourite and underdog win percentages into odds:
Home wins (Favourite): 56.48% = 1.77 [European odds]
Home wins (Underdog): 22.77% = 4.40 [European odds]
The above two odds are “inflection points”, the points on a curve at which the curvature or concavity changes from plus to minus or, from minus to plus. Translated into layman’s language… the pivot points along the profit/loss curve where profits turn to losses or, where losses turn to profits.
However, these are purely the mathematical inflection points and do not take market forces into consideration.
Therefore, please do not start betting on every favourite at home priced below 1.77 in the EPL, or on every underdog playing at home priced above 4.40. (Although following this simple strategy would have produced quite a profit!).


Hi,
Thanks for getting back to me. I guess I thought I could apply some of the knowledge gained in the OU course to calculate HDAFU odds and value with these bets, but I guess your tables do this job! My next purchase will be an HDAFU table or two so I can expand my portfolio. Which HDAFU tables would you recommend to start with?
Hello Gary,
All of the HDAFU tables contain something of interest, and we also backdate the discounts for multiple purchases if you decide to buy the tables on a drip feed basis.
In other words, if you buy two now, we’ll refund the 20% offered once you have bought your fifth table, and so on.
Just drop us an email to tell us when you reach each discount threshold.
A couple of recommendations to begin with?
Well, Italy Serie A and the German Bundesliga are great examples. You can get them here.
Thanks again for your contribution and best of luck!
Hi,
Following on from our previous conversation, I purchased the over / under betting course which has proven invaluable in working out how to calculate odds. I love your products!
I’ve read the PDF from cover to cover several times and I’m confident with the maths, but now I’m struggling how to apply it?
I’ve built a spreadsheet using the main leagues in Europe from football-data, so I can compare the odds between teams present in the respective leagues for 5 years, but then for some cases you don’t need to do that and you only need 25 games history.
I like the idea of mixing systematic strategies with individual team strategies, but to be honest I don’t know where to go from here.
Thanks again,
Gary
Hi Gary, from our previous conversation I understand that you are struggling to make heads and tails between the Fundamentals of Sports Betting Course and the HDAFU Tables. These two products are totally unrelated!
Both products, of course, address the gambling market, but they look at betting not only from totally different perspectives, but also at different markets. The course is for Over/Under markets whilst the HDAFU Tables are for the 1×2 market.
The course… allows you to calculate each match individually; you can compile a portfolio of bets for any weekend of your choice; you don’t need to bet each weekend during the season without fail; you can carry out the calculation well ahead of the matches
The HDAFU tables… are a tool to develop a betting system for constant betting on one or more leagues, e.g. betting on the underdogs in the German BL if the odds are higher that X; the HDAFU tables don’t require calculations each weekend or any understanding of maths, but… the HDAFU tables require the punter, once he/she hve decided which system to play, to start pretty close to the beginning of the season, or at the start of the second half of the season. A betting system developed with the HDAFU tables requires that bets are being placed every weekend during the run of the system without fail.
Summa Summarum… The HDAFU Table are for ‘Systematic Betting’; the course is for ‘Strategic Value Betting’.
Back to the course… it does not matter if you use the Cluster Tables to calculate the probabilities and make your picks (5 years data), or the VC approach (last 25 games and H2H results). You have the choice to pick one of the two which you find more comfortable to use. I explained both in the course because in the 1st edition of the course, I hadn’t explained the VC and we’ve had plenty of queries enquiring on how to use the VC for Over/Under betting. This is why the VC was included in the course as an alternative to the Cluster Tables.
There are many roads that lead to Rome. Which one you finally take it’s totally up to you. 🙂
Hi Soccerwidow,
You write… ‘the HDAFU tables require the punter, once he/she hve decided which system to play, to start pretty close to the beginning of the season, or at the start of the second half of the season. A betting system developed with the HDAFU tables requires that bets are being placed every weekend during the run of the system without fail.’
I’m still doing the Fundamentals of Betting Course and am not quite ready to start betting. Plus, it would be a good idea for me to papertest.
Does this mean I can’t properly do a weekly portfolio of betting systems (based on the HDAFU tables) until the beginning of next season, or at least halfway through this season? Would it be ill-advised for me to use the HDAFU and to jump into the betting in a month’s time or so?
Also, I gather this is a wholly different system to using the value calculator to analyse individual matches and to make a weekly portfolio of bets based simply on bets I find which have value? Is it fine to start using the value calculator to place a weekly portfolio of value bets at any point in the season?
Hello again Audiendi,
The HDAFU Tables are designed for long-term system betting, whilst the Value Calculator can definitely be used as and when required on individual games or weekends.
Therefore, it doesn’t matter when you start betting with the Value Calculator – you can dip in and out of a season as you see fit.
With the HDAFU Tables, it also doesn’t really matter when you start, so long as you view the exercise as a long-term project and are prepared to keep it going until you have met your personal targets or need a break.
However, with both approaches, the start of a season is usually the most volatile time as results are a little more random, with more statistical noise, and a league usually takes several rounds before things have settled into recognisable patterns.
As ever, we advise that you paper test everything before committing real money to any strategy. You may feel that having done all of the homework to prove that something works historically, that it must also work going forwards, and that it is okay to risk money from the start.
However, you will often find that things need fine-tuning in a live arena and this is a painless exercise if you don’t have to worry about losing money at the same time.
You will also find more focus to getting a system right if you are looking objectively at the situation rather than being emotionally drawn by a series of bets during the experimental phase. Placing those initial bets on paper achieves exactly the same result.
Hi it’s ok I know that they’re different bet types. I’m just very interested in exploiting the mismatch in bookie’s odds, whether it be 1×2 or under/over goals. I’m also very interested in working out how to calculate the odds. Just confusing which one to choose now, as a novice.
Go for the course. It’s a very comprehensive piece of work which teaches a huge amount about betting. One of our readers even said “It’s not just about over/under betting. It teaches you everything.” You will learn how odds are calculated, how bookmakers make their money, false beliefs are being removed.
Thanks for your help. I may try the over/under x goals pdf as this comes with the bundesliga table.
Hi Gary,
1×2 and Over/Under are two completely different bet types. The tables, you were referring to in your previous comments are 1×2 simulation tables, the course is about Over/Under betting. Right now, there is no course on 1×2 betting, only the tables.
In addition, the 1×2 tables are for ‘systematic’ betting, and the Over/Under course is for ‘value betting’.
Thanks for this question, I will see if I address it in an article as you are probably not the only one who gets confused.
thanks for the reply. Was thinking of doing some small stakes testing of the tables for this season, maybe start with the Bundesliga or Eredivise.
Hi Gary, if you are thinking of starting with only two, try the Bundesliga and France Ligue 2. They both play uncanny ‘statistically correct’. 🙂
Hi. Fascinating website. I’m very interested in purchasing a 1×2 table. Which leagues prove to be the most profitable, year in year out?
Hi Gary, there is no league which stands out to be more profitable than the other. They all have different inflection points (meaning different profitable odds clusters).
What you are looking for, is a portfolio of different leagues in order to spread the risk and to increase the number of bets for one betting round.
Whatever system you choose, for a betting round you may find 2 matches in one league which fit, and only 1 match in another league. This is far too little for one weekend. What you want is 10 to 15 matches for one weekend, and this means, at least 5 different leagues to diversify your risk.
Hello Charles,
Thanks for your very valid comment.
Consistency is the key. Stick to Pinnacle if it’s easier for you, or pick the highest odds from a selection of bookmakers. But don’t mix the two approaches.
As you are always looking to place bets at the highest prices available to you, then it is probably better to choose all the bookmakers you have accounts with. This will provide you with a more realistic picture.
Of course, the fewer games you analyse, the more margin for statistical error there is. If you are analysing five seasons’ worth in any league, then choosing just one bookmaker will usually suffice. If it’s a smaller sample size, say just one season, then a bigger pool of available data would be better – i.e. data from several bookmakers.
I hope this helps and good luck!
Hi!
When trying to calculate ratio bets, should one use odds from one site or can it be from different sites to get the best odds?
For ex. when looking for 0.78-0.84 ratio (Draw odds / Away odds), should I use the Draw and Away odds from Pinnacle, or should I use odds from two different sites if I get higher odds?
Hello again Betakos,
I am sorry but I do not really understand the question – What exactly do you mean by “How the home win % are different?”
Please explain in a little more detail to help me answer your query.
Many thanks.
Hi there ok lets just focus on why the mathematical inflection point for home favorites differs to the market one? What are the calculations for finding the markets inflection point?
Hi betakos,
the inflection points are the points where when betting on a specific result profits turn into losses, and vice versa. There are certain odds clusters in which bookmakers constantly reduce their prices to ensure profits, and other odds clusters, where the demand for bets is low, and therefore these prices are increased.
Sorry, I cannot explain in a few words how to calculate this. It’s a pretty complex topic.
If I understand correct we compare the mathematical inflection point of a league to a certain cluster of the league. I use your idea of clustering home odds/away odds. So lets say the mathematical point for premier league is 40% for home favorites and the 0,55 cluster inflection point is 55% how should I behave then
Ok i feel a little bit dummy. Could you explain why the mathematical inflection points differ to the markets?i can not follow on this. How the home win % are different ? We still have the same wins out of the total dont we?
Thanks in advance and keep it this way. Very good job
Your site is the most interesting and most valuable that I’ve seen until now after more than 10 years of betting … or trying to bet 😉
A must read!
Hi,
I have my Question: are calculations based on a Fixed win/risk Staking Plan or not?
Thank you
Hi Roman,
all calculations are based on a fixed risk (backing using the same stake) staking plan.
Hi,
This was a very informative piece. Can I just ask, in the graphic above, do the leagues match up as follows?
League 1 – Belgian Jupiler League
League 2 – German Bundesliga 1
League 3 – English Championship
League 4 – French Ligue 1
League 5 – English Premier League
League 6 – Dutch Eredivisie
League 7 – Scottish Premiership
Thank you
Sorry John… No, the leagues do not match up in this order.
Although this article is certainly a helpful educational piece for the public, it is mainly written for buyers of our HDA tables to help them to understand how to utilise the simulation tables to compile a winning portfolio…
Backing the underdog at home in some leagues is only one subset of a plethora of possible betting strategies.
At Soccerwidow we educate bettors in odds calculation and how to develop your own winning strategy. We strongly believe that it is crucial to understand the betting market and odds calculation in order to become a long-term winner.
Every bettor has his/her own preferences and therefore, it is simply impossible for us to provide picks or any ready-usable strategies applicable to a wide audience.
Hi, I enjoyed the article, I have been reading Soccerwidow for a while, and I would like to thank you very much for these instructive articles.
But I didn’t understand how the bets on favourites at home work. Could you please explain better?
I think I get it with the Home underdog. If the dog has a probability of winning of 22.77%, placing a bet at odds of 6.2 will have an expected value around 1 times the bet. Then, clearly if the odds are greater than 6.2, the expected pay will be large than the bet size.
But it seems that the same logic should work for the home favourite. If the favourite has 56.48% probability of winning, odds of 1.77 will make the expected received value to be 1 and anything above will be a profit. Why then, should we bet on favourites with odds BELOW 1.77?
Could you please explain?
Thank you.
Hi Alex, odds calculation and making profits from betting is a very, very complex matter. I’m sorry for your confusion, but there is no short answer to your question which I could provide here. I would have to dive deep into statistical analysis, distributions, etc.
However, I’m currently working on a 1×2 odds calculation course and many thanks for your question, I will remember to address it in depth in the course. Questions like yours help hugely to know what topics need to be addressed, explained and explored.
Great piece! I really enjoyed it and it has grabbed my interest even more than most of your work.
My only question is how you calculated the actual market inflection points in the EPL. You mentioned that the HDA simulations will help you but I’m not sure you fully explained how it is worked out. What data is used for you to get odds of 1.50 & 6.20?
Apologies if this was explained and I didn’t pick up on it.
Hi Matt,
Thanks for the praise 🙂
The tables this year have received a serious upgrade, and they calculate up and down the ladder (almost) every direction the user wants to explore. We are planning to publish a video which guides the process of identifying the inflection points in the HDA tables. Watch this space!
Hi Matt, I just uploaded the promised video on Youtube. An article to go with the video is in hand.