Goals Galore – Relative Deviation Graphs
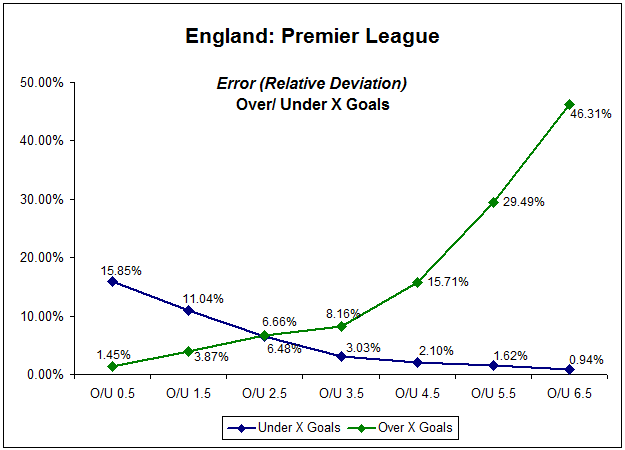
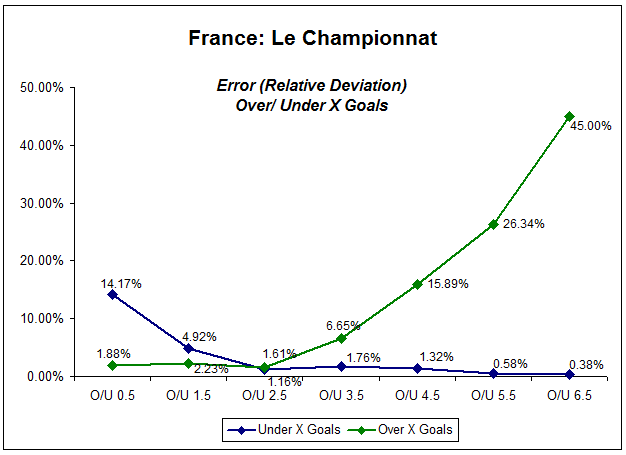
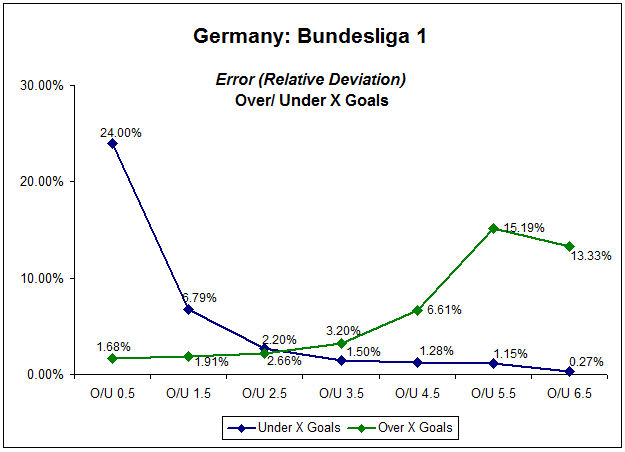
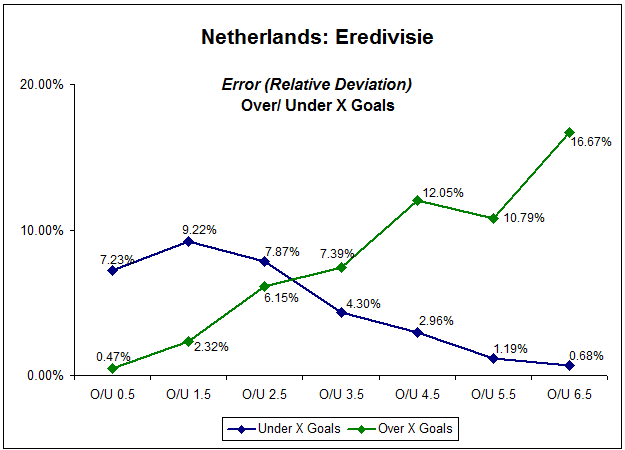
Taking the same information we used to build the first set of four graphs, we can now produce graphs showing the relative deviations (the average figure over five seasons), which will shed more light on the statistics from a betting perspective:

English Premier League 2006-2011: Over/Under ‘X’ Goals – Relative Deviation

French Le Championnat 2006-2011: Over/Under ‘X’ Goals – Relative Deviation

German Bundesliga 1 2006-2011: Over/Under ‘X’ Goals – Relative Deviation

Dutch Eredivisie 2006-2011: Over/Under ‘X’ Goals – Relative Deviation
Interpreting the Relative Deviation Graphs
Looking at the graphs you will see that the ‘over’ and ‘under’ goal event curves again intersect somewhere between two and three goals in all four leagues.
 Image: Michiel de Wit (Shutterstock)
The meaning of this is that bets on ‘over 0.5, 1.5 and 2.5 goals’ have a smaller variance (error).
Therefore, they are “safer” selections than bets on ‘under 2.5, 1.5 or 0.5 goals’, which show greater fluctuations in distribution over the five seasons.
After the curves cross the situation changes and the under ‘X’ goals curve shows a diminishing relative deviation (error).
Once again, this means that bets become “more reliable” (i.e. they have a smaller and smaller variance), the higher the under ‘X’ goals event category climbs.


Thank you for sharing this article. So in an attempt to be more practical. Assuming we detected that under 1,5 goals has an average of 9% success with a deviation of +-1,5%. That would mean the range should vary from 7,5% to 10,5%. How could we build our portfolio? Take the worse scenario of 7,5% which means we need a minimum odds of 1/0,075 equals 13,33. But who can guarantee that we will get these odds from the bookies?
Hi betakos, there is no “guarantee” that you will get your desired odds from the bookies. If you use exchanges such as Smarkets then, of course, you can “ask” for your desired odds and hope that somebody matches your bet.
Do you know my course Fundamentals of Sports Betting – Over/Under X Goals? In part 2 I explain in great length how to utilise the knowledge of odds calculation, and with the cluster tables which come with the course I provide readers with a powerful portfolio betting tool for value betting.