Cluster Table Screenshot - Betting Table Tab
Soccerwidow’s Cluster Tables are an essential tool for identifying value bets and creating a profitable portfolio in the Over/Under ‘X’ Goals market.
They rely on dividing historical data (previous five complete seasons) into clusters according to the “HO/AO quotient” to provide a reliable comparison with future matches under analysis.
Betting odds are a mixture of statistical fact and public opinion (people voting with their money) as to what the likely outcome of an event will be.
Introducing the HO/AO quotient allows us to to ‘cluster’ groups of past matches and with that, to quantify the mutual relationship between the number of goals scored in matches and the strength of the teams involved. (The HO/AO quotients are a practical application of corellation).
This allows us to put an upcoming game into perspective.
In other words, we use the group of past matches bearing HO/AO quotients most similar to the match under analysis in order to make more accurate assessments about its likely number of goals.
The number of goals scored↔team strength relationship is a hugely strong correlation known to the bookmakers and used to a greater or lesser degree when setting their opening odds.
However, as public opinion (market pressure) leads to ‘errors’ in market pricing (odds), using the knowledge of the correlation allows us to spot ‘value’.
Following on from our Betting with Cluster Tables introductory article, here are the four simple steps needed to calculate pinpoint zero odds for intelligent value betting decisions in the Over/Under ‘X’ Goals market:
- Find the Home and Away Odds
- Calculate the HO/AO Quotient
- Record the Cluster Table Results
- Perform the Final Calculations
We shall look at each of these steps using the English Premier League as example.
Let’s look in fine detail at the EPL match: West Ham vs. Southampton from 31st March, 2018.
Step 1 – Find the Home and Away Odds
One of the most important components of the Cluster Tables is the HO/AO quotient (home odds divided by away odds), hence the need for both odds before referring to the tables.
To find the latest, up-to-date odds for any fixture you can employ bookmakers or betting exchanges of your choice, or make use of an odds comparison site. For the sake of our example, we are using OddsPortal.com as they are the only site showing time-stamped odds to support our illustrations.

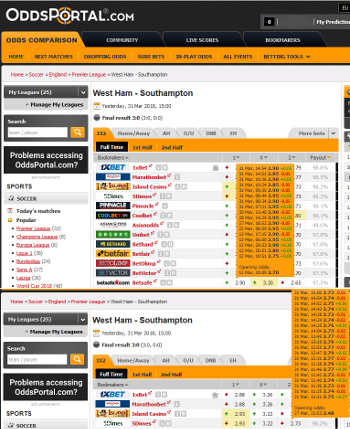
The screenshot on the left is a composite image showing both the home and away odds just before this game started. Click on the image to enlarge it in a new tab.
Betsafe offered a price of 2.90 on West Ham six minutes before kick-off, whilst 5Dimes gave best price of 2.73 on Southampton seconds before the start.
Despite the multitude of odds movements throughout the entire ante post market, you will find in the vast majority of cases that the relationship between the home and away odds will stay pretty much the same throughout the ante post market.
Usually, the HO/AO quotient locates the match firmly between the two ends of a cluster, and the quotient tends to remain in that same cluster group no matter how the odds move during the lead up to kick-off.
This means that the timing of the analysis is not critical; you can perform it at any period during the ante post market before the match kicks-off. And of course, bet placement timing then also becomes just a matter of finding market odds containing value.
Timing only becomes an issue in the very rare event that the HO/AO quotient places the match very close to one of the ends of the cluster range for either team. It is then always wise to check odds close to kick-off to ensure that you have the match in the right HO/AO clusters for both teams.
Most of our tables are based on Pinnacle bookmaker odds, and for these leagues, you need only find which odds Pinnacle is offering at that time.
A small number of our tables use the highest audited bookmaker odds from a select panel included at Oddsportal. For these leagues, you will need to find the highest home and away odds being offered from a small range of bookmakers at the time.
Okay, we have our home and away odds – onto the next step…
Step 2 – Calculate the HO/AO Quotient
Easy! Take a calculator or enter the figures into a spreadsheet and just divide the home odds by the away odds to provide a quotient.
In this case, the quotient is: 2.90 divided by 2.73 = 1.0623 (rounded-up)
Step 3 – Identify the Relevant Cluster and Percentage Result
Cross-checking any team’s HO/AO quotient against their statistical percentages for any of the over/under 0.5 to 6.5 options in any match under analysis is extremely easy.
Within the Cluster Table for the appropriate league, click on the Betting Tables tab. This reveals a one-touch spreadsheet for obtaining both team’s results.
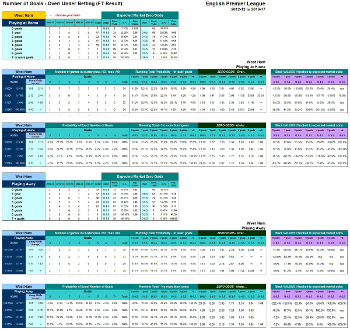
Here is the table of figures for West Ham (click on the image below to enlarge it in a new tab – and then use the magnifier to enlarge again if necessary):

To change the team, simply click on the orange team name in the top left-hand corner to access the drop-down menu of all teams with five-season data sets.
By clicking on the team you are looking for, the figures in the table will automatically revert to those of that team.
The first half of the sheet contains the home figures: Summary at the top, Over ‘X’ Goals, and then Under ‘X’ Goals. The bottom three panels are the away results.
For this example, let’s decide to go for the most popular ‘Over 2.5 Goals’ bet.
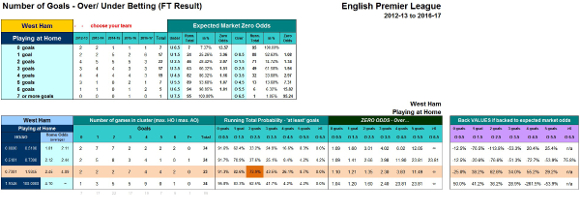
For West Ham’s home figures, using the second panel from the top, you can see on the left-hand side in dark blue, their dedicated HO/AO clusters.
The HO/AO quotient we have calculated is 1.0623 and this fits neatly into the third cluster down. Looking under ‘Running Total Probability’, we simply record the percentage figure, in this case, 73.9%.
Here are West Ham’s top two panels with the relevant cluster row and percentage result for Over 2.5 Goals highlighted:

And after changing the team name, here are Southampton’s away figures in their fourth and fifth panels:

You will also note that the HO/AO quotient fitted very firmly inside the relevant cluster group of both teams, and not too close to its edges (West Ham’s cluster group was 0.7301-1.9345, whilst Southampton’s was 0.8211-1.3880).
Again, you will rarely encounter situations that will need monitoring – most games will see the same cluster groups used despite the odds movements throughout the ante post market. This means that neither analysing nor placing the bets is time-sensitive, and both exercises need not be performed at the same time either.
Next Page: Step 4 – Do the Maths!


Yes I have worked through it all, the only issue is that what it seems to be based on (odds inflation) appears to be contradictory to what I have been used to using in my other betting.
I was always told that “odds inflation” does not exist by the kick off time on an exchange.
The price it kicks off at was always viewed as infallible on the exchange because the free battle between backers and layers always settles it fairly.
It seems to be saying that thousands of people cant get it right between them.
Just to name a few factors that influence the prices (odds)…
When odds are initially set, they are based on statistics plus the expected market demand as judged by the bookmakers.
When the exchanges open the markets, traders come in (including bots).
One hour before kick-off, the public emotions become very strong when the team news is being published.
So you think its best to wait until team news is published before we enter the bets?
Hi Andy,
Your question was about ‘odds inflation’ and I answered with a few examples that affect odds (= prices of bets) (i.e. rising or falling). The fluctuations go in both directions simultaneously. When one side goes up, the other goes down. Further detail on this topic is contained within the pages of the Odds Calculation coursebook.
I am still unsure how I can make money long term from this unless I beat the closing line of the exchange or a sharp bookmaker like Pinnacle. I have always been told that beating the closing line of an exchange is the only way to take value since the market knows everything its possible to know about an event and thus it is reflected in the price.
Hi Andy, how to make profits when using the Cluster Tables is described in minute detail in the Over/Under course book: https://www.soccerwidow.com/products/over-under-goals-fundamentals-sports-betting/
The market ‘knows’ everything possible but the different markets are connected and especially public expectations put a lot of price pressure on the odds. So, for example, if Bayern Munich plays away from home a weaker team at their home grounds, everybody is expecting to see lots of goals in that match; however, analysing the upcoming match statistically, the weaker team may be actually pretty strong in defending their own goal, even against teams like Bayern. In this example, the Over odds would be all inflated and you can recognise that using the Cluster Tables.
Have you worked through your course book from the beginning to the end, page by page?
Hi,
I have noticed that sometimes the ho/ao result will be in a certain cluster – however when I look at the odds they will be in another cluster, the “average” odds section I am talking about.
So what should I do when they do not both align?
Hi Andy, I assume that you’re referring to the ‘home odds (average)’ display on the ‘Betting Tables’ tab?
They are for information purposes only, to help people to get a feeling what the HO/AO clusters mean, especially when looking through upcoming matches, in order to identify quickly matches that may be in the correct cluster. Nothing else.
No, they do not have to align. It’s only the HO/AO quotient that matters.
“However, if you bet on portfolios then it is sometimes a good idea to include all bets above ‘zero’ odds, even if they are ‘only’ within the ‘fair’ odds range to spread the risk as much as possible.”
Is what you are saying here one approach is just to take all the bets that are above zero odds and disregard standard deviation in order to smooth out the variance?
Hi Andy, you’ve just bought the course book a few days ago. Please be patient and first work through the whole course book; page by page; chapter by chapter. It is a lot to comprehend but once you succeed to understand you will be able to answer your question yourself. To truly master betting a huge learning curve is required. It takes time and a lot of hard work. You are just at the beginning.
Good luck!
So on my first attempt to calculate anything, I found that the upcoming 1/12 match Werder vs Bayern the fair odds of o2.5 is exactly 2.0, and the betfair odds is 1.48 which is way out in the wrong way for a value bet.
Anyone can comment if I got it right? TY
Andy, please work through the course book! You will find the answer to that there.
It’s an away game for Bayern and they are far less strong when playing away than when playing on home grounds. Therefore, the odds you calculated for O2.5 are probably right. Bayern Munich away games are always excellent examples where the bookmakers take huge advantage of the lack of knowledge to calculate probabilities by the majority of punters.
Anyone been able to get these tables to work on a mac?
I tried numbers, google sheets but they both don’t work properly.
Only other thing is if I get excel for mac.
Hi Andrew, I’m sorry if you don’t get the tables to work on mac. Do you have anywhere where you have access to a PC?
Alternatively, just print out the course book. The layout allows for double-sided printing and binding. To work through the course book you don’t necessarily require the Excel tables.
Oh, another question popped up, this one seems more legit…
I have noticed that the %CV values for over and under x goals are the same in Japan, Ireland, and Iceland for example.
Yet in South-Korea and Sweden for example, they are different.
am having trouble explaining that to myself. Can you shed some light on this?
;
Thank you 🙂
Hi AM0751,
the CV% should normally be the same for Over and Under as you see it in Japan, Ireland and Iceland for example.
South Korea changed the format in 2014: from former 266 matches per annum it reduced to 228. Same applies to Sweden; it’s not as massive as in South Korea but there were two void matches in the five years of data.
Therefore the uncertainty (deviation) in South Korea is much bigger than in Sweden; and these two have a higher uncertainty that the ‘regular’ leagues like Japan, Ireland and Iceland.
I hope that makes sense.
Thank you very much for your answer. I have one more question.
On another page, right winger says that generally speaking, odds that have smaller yield (Value 2) than %CV values are candidates for lay bets.
Can you maybe expand on that a bit more? Let me give you an example.
For arguments sake, say we have a 75% chance on either over or under (zero odds).
Makes 1.33
The %CV is 2%
So fair odds are 1.3 to 1.37
Do the lay candidates need to be below 1.3 to qualify?
Or is a Value2 smaller than %CV already enough to have it qualify as a lay bet?
I hope I make sense! Looking forward to your answer.
It really all depends on the strategy you’re following and it’s all about risk diversification. The problem with ‘zero odds’ is that it is very unlikely that the observed results of the forthcoming season will be exactly matching the ‘zero’ probability (the mean probability of the last 5 seasons). Even with using the standard deviation to calculate the expected (= most probable) range there is only a 95% confidence level that the results observed in reality will be within the expected range.
Therefore, if ‘Lay’ or ‘Back’ within the range really depends on the strategy you’re following. It’s like throwing a dice… you’ve got there a 50/50 chance to have head or tails. That the distribution will be even 50/50 you will only observe, say, after you’ve thrown the dice ten thousands times. But if you only throw them 100 times (like you do in betting) then the observed distribution is likely to be uneven. It can be something like 55/45 or 45/55. Therefore, it really depends on your strategy if you decide to ‘lay’ heads or if you ‘back’ them during the 100 throws.
Generally speaking, everything below the ‘zero’ odds is likely to be a lay candidate, everything above a back candidate. But I say ‘likely’ not ‘is’.
Please disregard my last comment. I have been looking for an answer all over, and at the moment I decide to ask you about it, I see the comment below me addressed the exact same issue. Sorry about that, and have a nice day.
You too, have a nice day! I still replied to your comment as it was straight to the point and it will hopefully save other people’s time to search for an answer.
Hello soccerwidow,
A quick question.
You mention zero odds here, but there is no mention here of deviation at all, while it is prominently mentioned in the course. Should that not be the “extra” final step?
Hi AM0751,
this article is an abridged version (or call it, a subsequent example) from the course book. Problem is that the deviation part in the course book contains numerous pages; at least 16, to explain the whole concept in minute detail… No chance to be able to summarize that in a short article.
We will certainly at some stage publish mor articles on that subject but good things take their time. 😉
Hi RW,
I read and studied the betting over/under course book back in 2016/17 and for a while regularly used the cluster tables for finding over/under bets before focusing on the HDAFU tables.
In the course book I recall that standard deviation was a consideration and that when using the tables to find the percentage/odds for say over 2.5 goals, you would obtain the number for the home and away side, add them together, divide by 2, then apply the relevant standard deviation to that number. I recall the explanation in the course being that having markets odds over and above the zero odds is not in and of itself a marker of value; instead the market odds should be above the zero odds after applying the correct standard deviation.
I couldn’t see any mention of this in the article, so was wondering is this step no longer necessary in the method to find betting opportunities? I remember you guys saying the course was being updated, so am not sure if the method has been revised. It’s been a while since I used these tables and haven’t purchased an updated course, so I may be out of the loop a little!
Thanks.
Simon.
Hi Simon,
there is still the distinction between ‘zero’ odds and ‘fair’ odds ranges necessary, as explained in the course. And it still applies that odds within the ‘fair’ odds range (‘zero’ probability ± deviation) don’t really contain long-term value.
However, if you bet on portfolios then it is sometimes a good idea to include all bets above ‘zero’ odds, even if they are ‘only’ within the ‘fair’ odds range to spread the risk as much as possible.
The problem with writing articles for the website is that they have to be kept short & sweet as well easily understandable. The course explains value betting in much greater length and covers loads of different topics necessarily to understand odds calculation in order to find an edge in the bookmaker market. That is unfortunately not possible when writing a 1,000 words article for Soccerwidow.
However, what we should probably do is to add a box at the end of these articles with a disclaimer that the information provided in the article is an abridged version and/or a subsequent example from the course book. Thanks for pointing that out! We will keep that in mind. 🙂
By the way, how did you get on with the cluster tables before switching to the HDA tables?
Hi Soccerwidow,
Well, what I did was to backtest 2 seasons worth of results for 6 top European Leagues:
I decided to just focus on over/under 2.5 goals, no matter what the probability of that outcome would be. So I have an overall set of results for the seasons I tested, and also results when just focusing on bets with probability of success of more than 50%.
2015/16:
Overall results:
349 bets: 170 wins, 179 losses, 48.71% hit rate, £1100 profit
Over 50% chance:
272 bets: 148 wins, 124 losses, 54.41% hit rate , £2526 profit
2016/17:
Overall results:
359 bets: 182 wins, 177 losses, 50.70% hit rate, £4700 profit
Over 50% chance:
291 bets: 149 wins, 142 losses, 51.20% hit rate, £1513
It was strange to see those results because in the 15/16 season the bets with over 50% chance did better than betting on everything. The reverse was true when looking at 16/17 season.
I delved into individual game date to see why that may have been the case, and in the 16/17 season, there were many games that hit with big odds, especially for the under 2.5. There was one game at Barcelona which they won 1-0 and the odds for under 2.5 are around 7!
So it all really depends on what bets you want to take into your portfolio which will shape your final results. I can imagine it would be nerve wracking to watch Barcelona at home playing a minnow and praying for under 2.5 goals!
Hi Simon, it’s nice to hear that your back testing was so successful. 🙂
Can you perhaps try to avoid watching games that you have placed bets on (e.g. your example with Barcelona)?
I personally find it much more rewarding to carry out the calculations by Friday evening, place the bets, have a nice weekend off, and then check the results on Sunday evening.
This is the main reason why, over the whole website, I specialise in Ante-Post betting and do not indulge trading. This is to stop (or at least, control) these nerve wracking experiences.
But then again I don’t remember the last time I watched a match. 😉
Simon, I can confirm that I have never known Soccerwidow to sit through an entire match in all the time I have known her.
She truly is interested solely in the mathematics of predicting outcomes (and the bragging rights when she gets it right!).