
Why do gypsies have crystal balls? - So they can see themselves coming!
The end of the month has arrived once again and following 29 match analyses encompassing 67 more value bet recommendations, it is time for our usual reckoning.
June was indeed an exceptional month realising a yield of 16.4%. The formulas and spreadsheets we rely upon for league club games were modified for the neutral venue environment (for most teams) of Euro 2012 with an unprecedented level of success, which led to continuing bank growth:

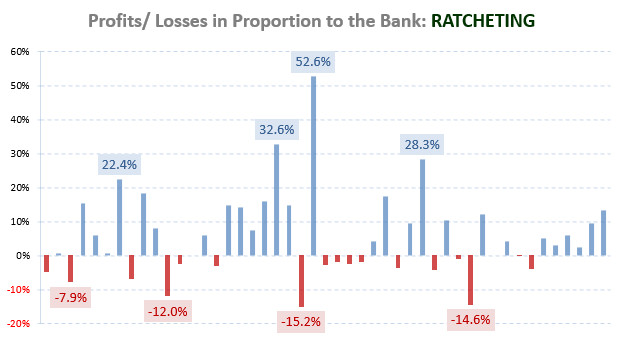
From this graph, it can clearly be seen that football betting in general is a very volatile venture. The jagged curve tells continual stories of success and failure, but the direction of the curve indicates that the portfolio system of ‘value’ betting tends to play according to statistical expectations, although an individual match may sometimes hold surprises.
The mathematical advantage or edge (i.e. ‘value’) achieved in June was 55.8% meaning that for every 1 unit lost 1.558 units were recovered. The average winnings per bet were 1.47 units making June from this perspective the best performing month so far.
Our entire experiment is based on a fixed win/risk staking plan (equal win, equal risk). This staking plan takes probabilities into account, meaning that there is a higher stake (i.e. risk) for bets with a higher chance of winning, and a proportionately reduced stake the lower the chance of winning a bet becomes (i.e. providing for more attempts to get a ‘hit’ at higher odds).
In essence this means the stakes employed depend upon the odds, but the risk and attainable profit remain constant. Our wagers in this public experiment have therefore always been limited to a maximum risk per bet of 10 units, or to a maximum win of 10 units.
Fixed Win/Risk Strategy Examples:
- Back Bets at odds of up to 2.0: Example 1.69; the stake (risk) is 10 units; if the bet wins, the winnings are 6.90 units; if bet loses, then 10 units are lost.
- Lay Bets at odds of up to 2.0: Example 1.69; winnings are capped at 10 units; if bet wins, the winnings are 10 units; if bet loses, the loss is 6.90 units.
- Back Bets at odds over 2.0: Example 3.5; winnings are capped at 10 units; if bet wins, the winnings are 10 units; if bet loses, the loss is 4 units.
- Lay Bets at odds over 2.0: Example 3.5; loss is capped at 10 units; if bet wins, winnings are 4 units; if bet loses, then 10 units are lost.
The next illustration (click to enlarge, opens in a new tab) shows computations of “Yield”, “ROI” (return on investment), and “Value” (mathematical advantage or “edge”):

From bet number one on 7th December 2011 to the close of play on 30th June 2012, a total of 274 bets have produced a net profit of 252.81 units from a starting bank of 50 units. The starting bank has been recycled several times with total turnover reaching 2,166.77 units at the end of June.
The average “Yield” is 11.67% (profit divided by total turnover), equating to an average of 0.93 units won per bet transaction.
The proportional increase of the 50 units starting bank comes to 505.63% (ROI 1) over 7 months, simply meaning that the bank has ‘quintupled’ in size. The average rate of return per month (ROI 2) calculates to 29.91%.
In 7 months a total of 694.66 units were lost and 947.47 units won, corresponding to a profit of 252.81 units. The achieved mathematical advantage or ‘value’ therefore equals 36.39% (252.81 units net profit divided by 694.66 units lost in achieving it).
Evaluation of the Cluster Groups
Sorting the 274 bets into their respective probability cluster groups shows the corresponding hit-rates have still not always achieved the exact calculated expectations (those highlighted in pink), purely because the sample sizes remain relatively small.
Nevertheless, the deviations are not huge, except in the ‘90% and above’ cluster group. We mentioned last month that this may be an indication of error in the probability calculations. Unfortunately, time has not permitted us to investigate this anomaly and we have therefore decided to suspend betting in this cluster group and paper-test some adjustments before reintroducing these bets into our recommendations.

The best performing groups were the 70-80% and the 80-90% probability clusters, which contain primarily “Dutch” lay bets, Over 1.5 goals bets, and Under 3.5 goals bet recommendations. Low odds, but high profits.
Final Proclamation
Overall, we can say that everything ran as expected.
There were no real nasty surprises and the games played out more or less statistically correct. Of course, appreciating that not every recommended bet can win helped us construct a betting strategy to make money in spite of this truism.
As explained in the article Probability, Expectation, Hit Rate, Value, Mathematical Advantage it is unrealistic to hope that every bet wins. For example, a 64.6% probability means precisely a 64.6% expected hit-rate; no more and no less! The VALUE lies in the odds (price), not in the hit-rate.
In the whole seven months since we started publishing match previews, not a single month has finished in the red and, as we have mentioned on several occasions throughout this website, successful value betting is purely a numbers game.
Although value betting on statistics is one of the most reliable approaches to football betting (and pretty much the same strategy the bookmakers employ), individual events have a habit of producing erratic results from time to time. Therefore you must never drift away from your staking plan and never chase losses.
Well, that’s the end of our public experiment for now. The time it takes to analyse each game, pick out bet recommendations, publish each article, and follow up with monthly summaries is, we can assure you, a huge burden on our time. However, we have proved a point over the last seven months that with the right tools and the right application it is definitely possible to make money with value betting.
Go back one month to May’s summary
The spreadsheet relies on inputting historical results for the game you are analysing in order to see how accurate the odds are being offered by the market. The formulas do the rest and display the value bets available for more than 100 betting options (including Asian Handicap HT and FT), leaving you to decide which ones to include in your portfolio.


Hi, thanks for the write-ups, I find your website has many invaluable articles. Your article about inflections had me mulling and playing with spreadsheets for over a month.
There is something about this article I fail to understand, or rather, I think I understand, but that produces a result that is counterintuitive,
Let me explain: you emply a fixed risk/win strategy. If I’d have to guess, this is to tackle the problem with variance.
HOWEVER: Isn’t it set in stone that this staking method is actually detrimental to your final results?
The fixed win/risk strategy comes into play to tackle the variance problem, and that is about it. Oh yes, it will llimit losses in a losing system. But who wants to play a losing system anyway?
On the flip side, it does eat into good results. Meaning that if you have a winning system, just flat betting with x% of your bankroll produces better results long term (in terms of return %, as this is the only meaningful comparison possible).
Which begs the question: why limit yourself using this fixed win/risk strategy, provided you have a winning strategy? What am I missing here?
Fixed win/risk is the only staking plan which makes one strategy comparable to another.
Therefore, for the sake of understanding and running this website we can only employ this staking plan when writing about strategies and calculating the outcome. Otherwise the reader wouldn’t be able to compare, for example, the betting results from June to the previous month May.
Anyway, in praxis, of course it is advisable to set a fixed %-age of the bank as the fixed stake/risk. That will increase the stakes when the strategy is winning, and decrease when the strategy is losing.
Thank you for your kind words. It’s always encouraging to hear that readers find the information in this blog useful. You have been added to our email list.
We look forward to your custom 🙂
Hi SoccerWidow,
Fantastic website and so informative and well written.
I’ll be purchasing your spreadsheet with the H2H and Asian Handicap in about a weeks time when I’ve done more research as not done this before but your aproach seems to be the best out there.
If you are still adding names to your mailing list I’d love to be included.
Thanks once again.
Wingnuts
Dear Soccerwidow,
Im often played over under on that 4 major league you mention before, and im very interesting for your idea about over under calculation, risk and reward. I hope you could share more a lot information for me.
Thanks for your favourble help,
Best Regards,
Hi Soccerwidow and her Bloke.
If possible i would like also to get on this (german and english match previews) list.
Thanks for that,
Roman G.
Ricardo,
I have added you to our mailing list – you will receive all future match previews.
Thanks for your interest in Soccerwidow
Hi,
Congratulations of your system and website.
How can I follow your match previous results in football, do I any subscribe anything.
Please can you help me.
Kind regards,
Ricardo Aivado