The end of the month has arrived again and after 17 match analyses and 48 more value bet recommendations, it is time for our summary.
May was the first month we published our value bet articles and predictions in both Betfair’s German blog and the Soccerwidow site.
To be honest it was a pretty difficult month. The major European leagues all came to the end of their seasons, concluding with various cup finals. These games although popular with the football betting masses were difficult in terms of finding ‘value’. This was probably because odds compilers and betting exchange users alike were able to find and use a plethora of available information to compile often uncannily accurate odds.
Nevertheless, despite the lack of value bet opportunities, Soccerwidow’s bank continued its upward trend. The mathematical advantage achieved in previous months was between 25-40%, but in May Soccerwidow achieved only 15%. The average bank gain in previous months was between 1.20 and 0.80 units per tip, but last month it was only 0.41 units.
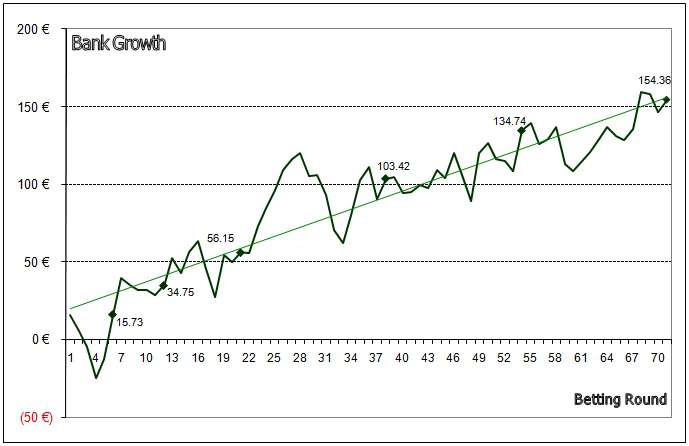
As we have already mentioned, finding bets with big slices of value attached was tricky due to the statistical accuracy of the offered odds, and as many of our tips held only small mathematical advantages (value), profits were always going to suffer:

Profit & Loss Development of Soccerwidow's Betting Prediction Results up to 31st May 2012
We are using a level win/risk staking plan (fixed win, fixed risk). This means the stakes employed depend upon the individual odds, but the maximum risk and attainable profit are constant. Depending on the odds, our wagers are always limited to a maximum risk per bet of 10 units, and where necessary also ‘weighted’ to win a maximum of 10 units.
Level Win/Risk Strategy Examples:
- Back Bets at odds of up to 2.0: Example 1.69; the stake (risk) is 10 units; if bet wins, the winnings are 6.90 units; if bet loses, then 10 units are lost.
- Lay Bets at odds of up to 2.0: Example 1.69; winnings are capped at 10 units; if bet wins, the winnings are 10 units; if bet loses, the loss is 6.90 units.
- Back Bets at odds over 2.0: Example 3.5; winnings are capped at 10 units; if bet wins, the winnings are 10 units; if bet loses, the loss is 4 units.
- Lay Bets at odds over 2.0: Example 3.5; loss is capped at 10 units; if bet wins, winnings are 4 units; if bet loses, then 10 units are lost.
The next illustration (click to enlarge, opens in a new window) is a table showing computations of ‘Yield’, ‘ROI’ (return on investment), and ‘Value’ (mathematical advantage or ‘edge’):
As at close of play on 31st May 2012, a total of 207 bets have produced a net profit of 154.36 units from a starting bank of 50 units. The starting bank has been turned over several times and totals 1,567.15 units at the end of six months. The average “Yield” is 9.8% (profit divided by total stakes), or an average of 0.84 units won per bet transaction.
The proportional increase of the 50 units starting bank computes to 308.7% (ROI 1) over six months, meaning simply that the initial bank has ‘trebled’. The average rate of return per month (ROI 2) calculates to 32.2%.
In six months a total of 518.09 units was lost and 672.45 units won, corresponding to a profit of 154.36 units. The mathematical advantage or ‘value’ was therefore 29.8% (154.30 profit divided by 518.09 units lost in achieving it).
Evaluation of the Cluster Groups
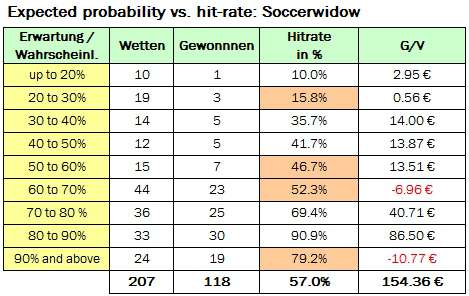
Sorting the 207 bets into their respective probability cluster groups shows the corresponding hit-rates have not totally achieved the exact calculated expectations, purely because the sample size remains relatively small. The clusters which remain slightly awry have a pink background.
Nevertheless, the deviations are not huge, except in the ‘90% and above’ cluster group. We mentioned last month that this may be an indication of error in the probability calculations.

All Bets up to 31.5.2012 Banded in Probability Cluster Groups
The best performing group is the 80-90% probability cluster, which contains primarily “Dutch” lay bets, Over 1.5 goals bets, and Under 3.5 goals bet recommendations. Low odds, but high profits.
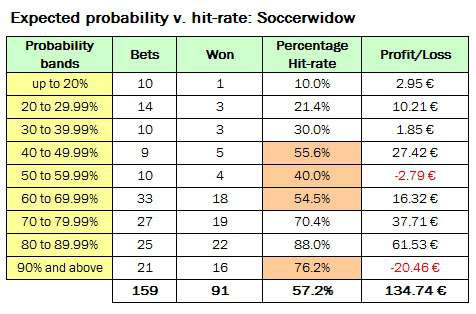
In May we made an adjustment to the ‘90% and above’ betting formula and comparing the May analysis above with April’s below you can see that there were 3 new bets in this group, all of which won. Thus, the hit-rate improved from 76.2% to 79.2%. However, we will keep monitoring this group.

All Bets up to 30.4.2012 Banded in Probability Cluster Groups
Summary
Overall, we can say that everything is running as expected. There have been no nasty surprises and the games have played out more or less statistically correct. Of course, calculations can always be improved, but a Yield of 9.8% is not such a bad result.
In the whole six months since we started, not one month has finished in the red.
Of course, just 17 matches in a whole month is a very small number, even if we choose two to three per game. In May we recommended a total of 48 bets but for more relevant conclusions, this is far too small a portfolio. We feel there should be at least 100 matches each month containing up to 300 value bets. Unfortunately, such match analysis is very time consuming and any more analyses are beyond our personal capacity.
- Go back one month to April’s summary
- Go forward one month to June’s summary
The spreadsheet relies on inputting historical results for the game you are analysing in order to see how accurate the odds are being offered by the market. The formulas do the rest and display the value bets available for more than 100 betting options (including Asian Handicap HT and FT), leaving you to decide which ones to include in your portfolio.


