
This article is a short journey to the theme ‘risk management’ as we are often asked…
How high should be a starting bank?
Is 5,000 units enough?
Well, there is no standard answer to this question. It all depends on the individual strategy.
 Image: Sergey Novikov (Shutterstock)
However, what is possible, is to calculate bank fluctuations (i.e. winning and losing sequences).
With the help of knowing the best and worst case scenarios you can determine the ideal starting bank for any betting system of your choice.
At the end of the article you will find a few useful exercises to practise, with the solutions available as a free download to all of you who would like them.
Length of Winning and Losing Streaks
It stands to reason that the smaller the probability of an event occurring (i.e. higher odds), the longer the likely losing streak will be (in between winning bets).
However, the big question is how often and for how long will the losing (and winning) streaks transpire?
It is possible to mathematically calculate many things with statistics, including streaks of luck and bad luck. However, it is important to note that no matter how accurate the results may appear, they are ‘models’ (a formal representation of a theory).
In this article, we are talking about probabilities; what can we ‘predict’ about how things may develop in the future. Please bear in mind that any such hypothesis is always a “could happen” not a “will happen”.
Of course, the larger the sample size (i.e. number of bets), the more likely the prediction is to be correct. But apart from the bookmakers themselves, who else has a betting portfolio comprising thousands of bets every weekend?
Winning and Losing Streaks Formula
The longest expected losing streak (or winning streak) can be calculated using the following formula:
n = number of trials (i.e. total number of bets)
ln = natural logarithm1
P = probability2
| .. | = absolute value or ‘modulus’
1Suffice to say, explaining what natural logarithm is would be worthy of a series of articles. For the time being, use Excel to calculate this for you.
2For winning streak calculations use the positive value (i.e. the probability of winning). For losing streak calculations use the negative probability value. For example, if the probability to win the bet is 33% then the probability that the bet loses (negative probability) is 67%.
In practice, the formula is best applied to situations where you constantly bet repeatedly on the same probability, for example, on ‘red’ at the roulette wheel: its probability remains exactly the same with every new spin of the wheel.
For football betting the concept is much more difficult to apply as each bet is likely to have a different probability (e.g. one Over 2.5 Goals bet with a 55.3% chance, and the next with a 62.1% chance, etc.).
However, you can group bets in probability clusters – for example, bets with a 55%-60% expected hit rate, bets with a 60%-65% expected hit rate, and so on.
 Longest Winning and Losing Streaks, depending on the number of bets (Examples for 50, 500 and 1,000 bets shown)
The tables above show the calculations of the expected maximum number of winning and losing streaks, depending on the expected hit rate (probability of the bet to win).
To read the tables, let’s explain the 70% line (odds in the region 1.4 and 1.45); in other words, bets with a 7 in 10 chance of winning.
The table on the left calculates the expectations of 50 tries (50 bets in a row, one after the next). You can see that the player will experience at least one streak of three lost bets in a row somewhere in the sequence.
On the other hand, he can expect at least one series of 11 winning bets in a row during the same sequence of 50 bets.
In contrast look at the 30% line (odds in the region of 3.2 to 3.4). In a series of 50 bets the bettor must expect at least one sequence of 11 consecutive losing bets, but will probably see only one set of three consecutive winning bets.
To develop a sense of probabilities and sequences, you can experiment with a dice. It has six faces; in other words, a probability of 16.67% (1 in 6 chance) of successfully landing on a chosen number.
Choose a number and count the number of throws until you succeed to roll it. Count also the number of consecutive successful rolls.
Choose two numbers that you do not want to roll (e.g. 5 and 6).
This means you have a 66.67% chance that one of the remaining four numbers is rolled.
In football betting terms, this equates to wagering on something like the full-time ‘Under 3.5 Goals’ market at odds of 1.50. (This experiment is just a little faster than waiting for 50 games to finish!)
Take a pen and paper and record 100 throws of the dice. If one of your four chosen numbers arrives mark a 1 on your paper; if the 5 or 6 are thrown, mark a 0. Count the number of winning and losing streaks you experience.
What is the maximum number of winning and losing streaks you experience in a sample size of 100 throws (bets)?
Having learned how to calculate the expected length of winning and losing streaks, the next question to ask is:
How many bets is it likely to take before I encounter ‘X’ losses in a row?
Timing of Winning and Losing Streaks
This formula is actually very simple:

= 1 divided by P, to the power of a
P = probability (expected hit rate or loss rate)
a = number of won or lost bets in a row
In the tables below you can see how many attempts (bets) it needs to experience a specific, expected length of luck or bad luck. Again, the assumption is that the bettor bets all the time on the same probability:
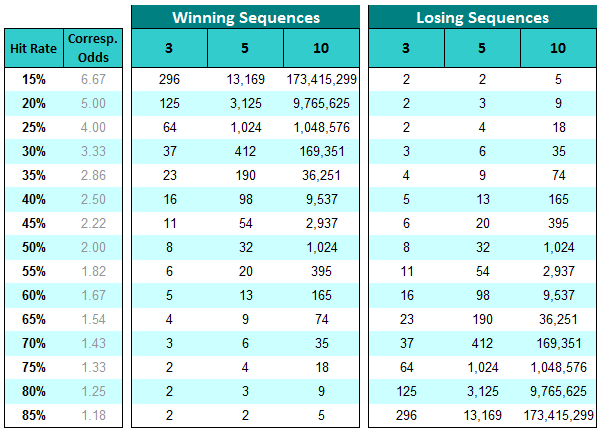 Expected time of occurrence of winning and losing streaks, depending on the hit rate
Reading the table:
Looking firstly in the right-hand column at the Losing Sequences, if the expected hit rate is 45% (what you should ‘expect’ at odds of around 2.2), then it is likely that you will experience a sequence of three losing bets in a row by the time your sixth bet is settled.
After 20 such bets it is likely that you will have seen a losing streak as long as five bets in a row.
Looking at the Winning Sequences column: you will win three times in a row at some stage during a series of 11 bets.
However, winning five in a row may only be seen once in every 54 bets.
As we mentioned before, in football betting it is extremely difficult, if not impossible, to find bets, all with the same probability of success.
However, you should at least try to understand the theory behind winning and losing streaks, as it will be easier on your nerves when you do encounter the inevitable run of bad fortune.
In particular, a thorough understanding of losing streaks is of enormous importance when setting both the size of your starting bank and stakes per bet.
Example:
A bettor prefers bets within the odds range of 2.0 to 2.5 with a hit rate between 40% and 50%. He plans to place 50 bets (e.g. two bets per round on 25 rounds of matches).
After looking at the tables, he knows that the maximum losing sequence expected is likely to be as long as six to eight lost bets in a row. Therefore, he knows that there may be at least one sequence of three or four consecutive rounds (weekends) when all bets lose.
After every 5th to 8th bet, he is also aware that he is likely to experience a loss of three consecutive lost bets (e.g. one weekend loses both bets, the following weekend only one loses).
He also knows that every 13 to 32 bets there will even be a streak of five losing bets in a row.
The bettor is fully aware that he has to take this into consideration and plan the starting bank accordingly to be able to ‘sit through’ these losing streaks.
Of course, he also knows that winning sequences will arrive too. In his case, with some ‘luck’, he may experience a winning sequence of five bets in a row after 32 bets. Every eight to 16 bets he will have a ‘lucky’ streak of three wins in a row.
This is certainly quite a fluctuation. When these ‘bad luck’ and ‘good luck’ streaks actually happen, nobody knows. However, what we do know is: They will happen!
Starting Bank – Rule of Thumb
A starting bank should be approximately five times the maximum expected losing streak. The reason for this is that a losing streak can happen right at the beginning, immediately followed by another bad run of luck. We are talking statistics here!
So if a bettor wants to stake 10 units per bet, the starting bank must be nine times (expected losing streak) the stake of 10 units multiplied by five = 450 units. Then he can risk 2.2% of his bank each time he bets (10 divided by 450). If losing, the stakes will remain constant at 2.2% and, if winning, raised gradually.
Questions to ask before setting the starting bank:
- What hit rate is expected (probability to win the bets)?
- How many bets are planned for the season?
- How long will the longest losing streak be?
- What is the desired stake per bet?
Calculation of the starting bank:
Exercises: Losing & Winning Streaks
- A bettor pursues a strategy with a win probability of 60% per bet (e.g. Under 3.5 Goals). He places one bet after the other; in other words, he waits for the outcome of each bet before placing the next. In total he places 50 bets.
What is the longest ‘losing streak’ (bad luck) that he can expect? How long is the longest ‘winning streak’ (luck) that can be expected?
- Same example as in (1): A strategy with a probability of 60% per bet; placing one bet after the other.
This time our punter is hoping for a ‘winning streak’ (luck) of 5 consecutive wins. How often does that happen?
- A gambler pursues a strategy with a probability of 20% per bet (e.g. ‘betting on the underdog’). Again, he places one bet after the other.
With a total of 500 bets, how long is the longest ‘losing streak’ that he must expect? After how many bets can he expect the longest ‘winning streak’?
- Same example as in (3): Strategy with a probability of 20% per bet; placing one bet after another
The bettor was hoping for a ‘winning streak’ (good luck) of five consecutive wins. How often does that happen? After which bet number should he expect ‘bad luck’ of five consecutive losses?
- Following the above two strategies (one with a 60% chance to win, the other with 20%) our bettor stakes 10 units per bet.
How high should the starting bank be for the 60% strategy, and how much for the 20% strategy?
Note: The initial bank should be approximately five times the maximum losing streak based on a total of 500 bets placed.
Answers to the Exercises
Just click on the button above and click on “Proceed to checkout” button in the new tab, then enter your name and e-mail address. Our automatic service will then deliver the file to you via e-mail, free of charge. The size of the PDF file is 320KB.
Optimising Your Bankroll
The factor 5 used in this article to determine the betting bank is a risk variable for risk-averse bettors. It is also the factor advisable for strategies with a 45% to 55% win probability (odds between 1.8 and 2.2).
Here is another article: How to Calculate Losing Streaks & Optimal Bankroll in which we provide a more detailed account of setting the ideal starting bank.
Risk management in sports betting is the foundation stone upon which all of your betting transactions should be built.
Risk management encompasses risk assessment, risk control and capital requirements, all of which cannot be addressed until you understand how winning and losing streaks are likely to impact upon your starting bank.


Hi, just a question. You mention in the article “Then he can risk 2.2% of his bank each time he bets (10 divided by 450). If losing, the stakes will remain constant at 2.2% and, if winning, raised gradually.”
Does that mean that even when losing and he has less than 450 units that he started he will still continue betting 10 per bet? Or is the stake still again reduce to reach the 2.2% of the new bankroll? I guess it stays the same and it only increases whenever the player reaches a new bankroll high, (for example having now 500 units so that he will stake 11 (500*2.2% =11) and continue to bet 11 even at losses until he reaches a new bankroll high again?
Hi John, sorry for the late reply but I was moving house in April.
Anyway, you may have already found the answer to your question. If not, here’s an article that goes far deeper into ratcheting and is more recent: Sound Staking: Flat Stakes & Ratcheting It will answer your question in great detail.
Have a great day and good luck with your betting!
Hello I would like to ask a question.
In 1149 games there are 30 0-0 games. According to the formulas the likely winning streak should be ABS(ln(1149)/ln(0.973))= 237 wins in a row but unfortunately the longest winning sequence is 121.
Why there is such a huge difference ? Is it because it is likely to happen but actually it will never will ?
Hi Nikos,
ist all about probabilities… it’s about the “maximum likely” winning or losing streak, not about the real one. The real one can be shorter (as you observed) or in very rare occasions, even longer.
That article is just to help readers to develop a sense of probabilities.
Can I download a spreadsheet with these tables in it?
Hi Jaap,
Yes, just hit the download button above and you’ll get the file free of charge…
Thanks Soccerwidow.
Hi Soccerwidow,
Thanks for your response.
Just wondering, is it possible to calculate the likelihood of the statistics occurring?
For example, in my earlier post Person A is following a method of betting that has a 50% strike rate and places 500 bets in a row on something. According to the formula they can expect to experience a losing streak of 9 bets in a row at some point. Is it possible to calculate the likelihood that the losing streak of 9 will in fact occur? e.g. 95% confident.
Cheers
Mark
Hi Marc, just google “Confidence interval”; there you’ll find a good number of mathematical articles on this topic.
Hi Soccerwidow. I’m not sure that I am following the information provided.
Say Person A is following a method of betting that has a 50% strike rate and places 500 bets in a row on something. According to the formula they can expect to experience a losing streak of 9 bets in a row at some point. Also, the losing streak will likely have occurred by their bet 402.
Say Person B is betting on the same thing as Person A and using the same method but is only going to place 50 bets. Person B can expect to experience a losing streak of 6 bets in a row at some point.
Say Person A places bet 390 and then experiences a losing streak of 9 bets. Also say that Person B places their 1st bet of 50 bets at exactly the same time as Person A places their 390th bet. This would mean that Person A’s losing streak of nine also becomes a losing streak of 9 for Person B’s first 9 bets. How does this fit with the calculation that says Person B will experience only 6 losses over 50 bets? Cheers. 🙂
Hi Mark, statistics is all about likelihoods, not about certainties.
So, say, 50% strike rate and 500 bets in a row … losing streak of 9 bets in a row at some point … by their bet 402 .. that means a losing streak of 9 bets, probably no later than 402 … but of course, it may happen earlier, say, after bet no. 300, or even bet no. 52, or whatever… it can even happen twice…
Person B (with 50 bets only) is likely only to experience a losing sequence of 6 only, but again… likely… not certainly!
It’s statistics… probabilities… not certainties… In life, there is actually only one certainty… everybody will die one day… but when???? this is statistics… average life expectancy, say, 74… Is it certain that your neighbour will live until exactly 74 years of age? Or anybody else you know? No! They may or they may not. The only certainty is that they won’t live forever.
Explain me something to see if i got this right. IF someone starts to bet on odds around 1,3-1,33 at least one time he will win 10 times in a row and he will need to try 13 times just to get it one time. I know that it’s theory but this is what statistics suggests? Am i right?
Hi Nikos, please take a dice and choose any number, e.g. 1. Each site of the dice represents a 16.67% probability; this means that throwing the dice and getting any number but the chosen one you have a 83.33% probability. This represents odds of 1.2; not exactly 1.3 but close enough to help you to develop a feeling for probabilities.
Now get yourself a pencil and pen and start throwing the dice. Every time you throw the 1, please note down ‘L’ for ‘lost’, and any other time ‘W’ for won.
Throw it as many times as you want and then count your ‘losing streaks’ and your ‘winning streaks’. You’ll note that you will come pretty close to the calculations but not exactly. This is statistics! Prediction isn’t an exact science.
Have fun! 🙂
If you have a 50% probability bet and you are going to play up to 50 hands is there a way to calculate when to quit? (not to push your luck) I might be up 6 base bets and after 20 plays (blackjack) and then the law of averages knock it down to 15 at the end of 50.
Thanks 🙂
Set yourself a financial goal when to quit. Quit when you have won a certain amount and consider yourself lucky that the distributions have been working your way this day.
Hi
Looking at the second table. How can you have 5 loses in a row at the end of your 3 rd bet at the 20% win rate?
Thanks for your great site.
Take a dice and choose one number (e.g. 6). The probability of throwing a 6 is 16.67%, not exactly 20% but close.
Now throw the dice and make notes. Every time you get a number which isn’t 6 write down “L” (lost) and if you throw a 6 then “W” (won).
Now count the winning and losing sequences.
This article is about distribution of results as they unfortunately don’t line up in a nice comfortable row, and it becomes very uncomfortable when people are betting with money.
Hi Soccerwidow,
I am an experienced Blackjack player playing Basic Strategy designed by the mathematician Edward Thorpe. So I am pretty close to 50/50.
The spreadsheet said I shouldn’t get 8 loses in a row in 100 hand but I got them in 67.
24 times I was able to double and win one unit. Then on then on the 59 game I lost 9 in a row.
Please explain.
Thanks
Hi Joseph, we are speaking about statistics. Unfortunately, statistics cannot be referred to as an “exact science”, because they do not admit of absolute precision in their results. In a context where uncertainty is present, it is by definition impossible to give a correct answer with complete assurance.
Therefore, when you calculate that you should experience a losing streak of 8 in 100 then it means that you will probably experience at least one losing streak of 8, but unfortunately, it may be two, it may be even longer, it may be after 67.
This article has been written to give people a glimpse on probabilities and help to develop a sixth sense for distributions. Did you do the exercise with throwing the dice as described in the article? Throw the dice a thousand times, not just hundred.
Statistics is the practice (or science) of collecting and analysing numerical data in large quantities. Large! 100 is tiny. Errors (= disturbance, deviation) get smaller the larger the numbers.
Got the spreadsheet today. Thank you very much.
I tried to calculate my optimum bank roll but I’m not sure I did it right.
I have a 99.6 % breakeven gov’t regulated blackjack game so the calculator say 7 max losing streak in 100 hands.
I play $5 a hand and bet 5 hands at a time (does it make big diference between dollar and Euro?)
So $5 * 7 losing streak * 1.5 RC = $56.5
Which doesn’t make sense because I have lost more than that in one session.
What am I missing?
Appreciate your help.
Hi Joseph,
I don’t really know how probabilities in Blackjack are calculated, but if you’d like to calculate your bankroll you need to know the probability to win (or to lose).
The problem with card games is that you have a permanent changing probability, therefore you need to be a real math wizard to be able to calculate the probability based on the cards themselves on the spot, but what is easy is to count the number of games you are playing and the number of games you are winning.
So say, you play 100 rounds of Blackjack of which you win a third which would mean a 30% hit rate. Reading the table in this article this would mean that every 35th session (in average) you will probably experience a losing sequence of 10 games. Of course, it may happen three times during the 100 games, and it may happen at any time and consecutive.
So, if you are limiting your total stake to a max. $5 every game (from the beginning to the end of one Blackjack game), then your starting bank should be
$5 x 10 x 5 (or 3, but not less) = $250
I hope my answer makes sense as I truly don’t play Blackjack.
RW, hi.
My question regards the minimun amount of bets to aprove a betting system. For example, I will point out a couple of situations:
1) 50 bets, Average Odds = 2.8, %Yield = 25%
2) 100 bets, Average Odds = 6.5, %Yield = 50%
My question is: how many bet will make me comfortable to apply a system?
Thanks!
Hi Gabriel,
to set your stake and number of bets to make you feel comfortable you need to work out the probability to win/loose. Neither the average odds nor the expected Yield are of any significance when calculating your bank and bet size.
Have a look at this article if it helps you: How to Calculate Losing Streaks & Optimal Bankroll
It would be useful if this article was accompanied by 2 calculators to calculate the probability of a win streak of x games in a sequence of y bets and another to calculate the probability of a losing streak.
Hi Charity10k,
Have a look at the link provided above in our answer to Vinoc.
Hopefully this is what you are looking for.
Thanks for your question.
Hi guys,
These calculations are quite difficult for many of us however I use the Staking Machine thestakingmachine.com to run my calculations. I have used it for a number of years and it’s definitely worth its weight in gold. It may be of some assistance to some of soccerwidow’s clients.
Cheers
Mark
Is there a downloadable Excel file for this?
Hi Vinoc,
you will find a downloadable Excel file which calculates losing streaks attached to this article: How to Calculate Losing Streaks & Optimal Bankroll