We are happy to announce that the 7th generation of HDAFU tables are now ready for sale!
This is a substantial upgrade taking customer comments and queries into account such as the request of reducing human error when identifying systems, providing more assistance when judging the volatility of an identified system, speeding up the process of constructing a portfolio, providing a better feel of the expected losing sequences, and much more.
Are you keen to understand the mechanics of our HDAFU Tables? We invite you to delve into the Austria Bundesliga version.
Try Out a New HDAFU Table for FREE. Access it by following this link: Austria Bundesliga HDAFU 1×2 Tables.
At checkout, use the coupon code: test_hdafu.
It is a fully functional table without any limitation. Maybe not the largest league on this planet, it will give you a pretty good idea of what to expect when purchasing HDAFU Tables for other leagues.
In appreciation of your continued interest, let’s briefly revisit the essence of the HDAFU Tables.
These tables are meticulously crafted tools designed for discerning football betting enthusiasts. Their primary function is to visualise and analyse the profit/loss patterns for 1X2 bets based on historical data spanning multiple seasons.
By examining these patterns, bettors gain invaluable insights into the nuances of market odds adjustments influenced by both bookmaker strategies and public betting behaviour. With the HDAFU Tables, you can navigate the betting terrain with clarity, identifying opportunities where others see mere statistics.
As the art of football betting continues to evolve, the HDAFU Tables remain your steadfast ally in making well-informed betting decisions.
Of course, we will be populating Soccerwidow.com with updated User Guides and How To articles over the course of the next few weeks, but for those who already familiar with the filtering process, we are sure that they will very quickly pick up on the new method.
The Mightiness of the HDAFU Tables
(1) bookmaker’s business model
The bookmaker’s business model is primarily based on two factors:
Firstly, they keep a small commission on every game via overround. This is well known.
What is less known is that bookmakers when setting their odds adjust them according to the expected weight of money to be staked (= public opinion), meaning that some odds are being lowered and others are increased.
Of course, bookmakers predict (calculate) the outcomes of matches as good as they possibly can on the basis of historical statistics and whatever price adjustments (odds changes) they make are not huge and only in the region of 2 to 3% of the expected true probabilities and therefore not easy to spot.
(2) the power of the hdafu tables revealed
Due to the market expectations that the sum of the three likelihoods of home ~ draw ~ away must add up to 100% the bookmakers’ business model leads to the fact that if one side of the 1X2 bet is reduced (e.g. reducing the home win odds from ‘true’ odds of 1.65 [60.6%] to say, 1.6 [62.5%]) the other two bets in this example, the draw and away win, have to be adjusted as well (e.g. the draw odds being increased from 3.57 [28.0%] to 3.70 [27.1%] and the away odds from 8.78 [11.4%] to 9.57 [10.4%]).
Of course, another market pressure is that bookmakers tout for market share and some bookmakers will therefore offer certain bets to inflated prices (odds). To stick with the example; although the away win should be priced (according to the above ‘adjusted’ calculation) at 9.57 one bookmaker decides to offer this bet for 15.0 [6.7%]. This leads in the market to a correction of the draw odds from 3.7 to 3.24 [30.8%].
This all doesn’t mean that the true probabilities of the outcome of the match have changed. They are still 60.6% [1.65] for the home win, 28.0% [3.57] for the draw and 11.4% [8.78] for the away win but the implied probabilities now show 62.5% [1.6] for the home win, 30.8% [3.24] for the draw and 6.7% [15.0] for the away win.
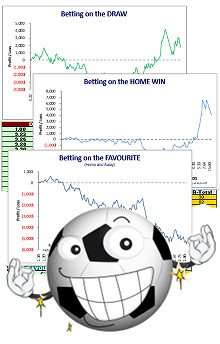
Here’s where the HDAFU Inflection Point Graphs come in: They display the turning points in the odds (the previous five seasons in each league) where bookmakers habitually increase or decrease their prices.
Our HDAFU tables visualise the profit/loss curves that a bettor would have attained would he have been betting on the all the matches during a period of five seasons and with that they reveal the bookmakers best kept secret – where they ‘adjust’ their odds due to market pressures and public opinion.
With the help of the Inflection Point graphs it is very easy to visually identify the turning points and with the interactive ‘system picker’ tab to narrow down the field of view and identify profitable betting systems.
The Main Upgrades from the Previous Version
All three scenarios (whole of season, 1st half, 2nd half) are now in one file. Instead of the three HDAFU tables per league like last season you now get only one. But this doesn’t mean that you get less for your money. On the contrary, you’re getting much more!
The HDAFU Tables are in a new style Excel workbook, with everything fully automated. No more time wasted filtering and amending formulas manually, one-by-one – it’s all touch of a button stuff now.
The fully automated ‘System Picker’ tab removes the need of sorting through the data and carrying out any manual calculations. All the necessary calculations are done automatically for you and you will see the results in an instant.
In addition to inflection point graphs by odds the new tables now also provide 15 additional analyses by ‘home odds divided by away odds quotient’ (HO/AO Quotient). The relationship between the home and away odds remains very constant throughout the ante post market. This allows identification of bets and their placement at any time during the ante post market, removing the need to place bets close to kick-off. In short, there are no more time restrictions and results should be more reliable.
The price per league remains sensible at £35.00 each.
We truly hope that you are going to love the new format of the tables and we would be very interested to hear any feedback on the new style table once you’ve had a chance to look at it.
HDA Betting: Profit/Loss Simulation Tables
PRODUCT SUMMARY
- Format: Excel .XLSX (compatible with Excel 2007 and higher)
- File Size: between 1.72 MB and 4.55 MB each
- Publisher: Hertis Services Ltd (formerly Soccerwidow Ltd); 6th revised edition
- Profit/Loss Simulations within each Workbook: Inflection Point Graphs by Odds and HO/AO Quotient for Home Win, Draw, Away Win, Favourite & Underdog, plus a breakdown of individual teams’ performance in each bet type from both a home and away perspective.
- Language: ENGLISH
If you have any questions please check our Frequently Asked Questions – HDAFU Tables
Comment for the Tables in their new format
It is very much an improvement on last years format and much much easier to use. It does take out a lot of the previous manual filtering and adjustments, which is important to minimise any errors made purely from manipulating the spreadsheets.
I do like its split between both, the odds and the HO/AO quotient and looking at it and comparing to previous. It certainly gives more insights to analyse. I also really like the time profile of the profit/loss over the 5 year period as this was one area I think last year I could have improved my portfolio with smarter decisions.
Michael


Hi Soccerwidow/Rightwinger
Hope you are both well.
I’ve purchased before the course book (extremely good book!), some cluster tables, and HDAFU tables; and it was the HDAFU tables that I found best suited my betting appetite and lifestyle. From there I carried out 3 campaigns using the HDAFU tables. The first campaign was purely paper tested and made a very good profit. The next campaign was a disappointment and couldn’t replicate the results of the first campaign. The third campaign started in August 2019 and started off very well, and the second half of the season was completely derailed by covid and the campaign ended break even I believe.
From there I took a break and in September of 2020 stumbled across Matched betting, which progressed to Arbitrage, and allowed me to build a very healthy betting bankroll. But now 4 years later, that has pretty much dried up and its not worth the time investment.
Anyway, I felt that after the 3rd campaign of HDAFU tables (even though it had been scuppered by covid) I had a much better understanding of it, and in practice been able to put something together that worked. I had intended to revisit it at some point, and now that matched betting/arbing is dead for me, I think perhaps next season will be a good place to start again – even if just a paper tested exercise for a while
A few questions if I may, to get myself back up to speed:
I recall when I last used the tables that some were based on ‘Football Data’ odds that were recorded on Friday evenings for weekend games (Tuesday evening for midweek games) and then some were based on Pinnacle odds from kick off. Is this the same now, or are they all based on Pinnacle odds from kick off?
Back when the HDAFU tables first came out, you guys recommended picking just one system per league. Is that still the recommendation, or would you advocate taking more than one system per league (provided they don’t clash in terms of the HO/AO quotient)?
Do you still recommend using the HO/AO quotient as the best way to select systems, as opposed to using the odds ranges?
Also, I remember the system picked being set up for back systems, and provided all the relevant figures like yield, zero odds etc. Can the sheet do the same for lay strategies, or would these need to be done manually?
Not necessarily related to the tables themselves, but it ties into the odds toggle. With previous campaigns, I used Marathon bet and Odds exclusively for my bets due to the very competitive odds, and being on par with those in the simulations. Marathonbet now don’t operate in the UK, and I can’t use those anymore. So It’s pretty much exchanges for me like Betfair, Matchbook, Betdaq, Markets that I will be using. I haven’t used Vodds in some time now – do you have any recent experience with VOdds? Are they still a safe operator to use?
Thanks!
Hi,
Is this for bookies only or applicable for exchanges too?
Hi Rainer,
This product is for both bookmakers and exchanges. The System Calculator tab includes a toggle to enter whatever exchange commission you are subject to. The tables will then automatically update. It is also important to note that the HO/AO and Odds graphs show the five-year trends for each of the five different bet types covered (i.e. H-D-A-F-U). Upward trends (graph lines rising from left to right) are indicative of backing strategies with both bookmakers and exchanges. Downward trends (graph lines falling from left to right) show where laying strategies with exchanges should be considered. I hope this answers your question and thank you for your interest in Soccerwidow.
hi SW do you make HDAFU tables with inflection points for each indivual team , for eg how do Man utd do when trading below 1.5 ?
Hi, would like to ask do you have Inplay odds? for all the full match time and score compiled odds?
Would purchasing 5 leagues be enough to collate the 500 bets required? Using 2 systems per league based on the HO/AO and by odds?
Hi Jamie, the statement of “500 bets required over one whole season” is just an advice for risk diversification. It is not set in stone. You can also look for at least 15 bets per round (week), or just concentrate on one half of a season and there for a total of 250 bets, and so on.
Yes, it is probably likely that you will find two (if not even more) systems per league with the ‘required’ number of bets. However, the much greater challenge is going to be to find enough low risk systems with a probability of well over 50% of winning. There I’m not so sure that 5 leagues is a sufficient number.