Our 7th generation of HDAFU tables introduces the HO/AO quotient as a selection criterion which has the effect of making your systems less volatile and your portfolio of systems more viable.
Furthermore, the HO/AO Quotient removes the need to stay in front of the computer in the last hour before kick-off and allows you to compile your portfolio of bets well in advance, hence reducing the stress factor and possible human error.
 Image: StockLite (Shutterstock)
What is a HO/AO Quotient?
The division of HO (Home Odds) by AO (AO Odds) reflects the “strength” of the teams. This makes upcoming games comparable with past matches, of which the results are known.
When building the quotient, we’re not asking ourselves questions like “Are these teams really equal?” or, “Is the favourite priced correctly?” We do not recalculate 1X2 odds; we simply use market prices and assume that the bookmakers have taken statistics into account and reflected public opinion (market pressures) as well as they possibly could do when setting their odds.
The HO/AO quotient is therefore an ideal device for comparing an upcoming match with the nearest batch of equivalent games against teams of a similar perceived strength to the opponent under analysis.
If for example, Liverpool are 1.34 to beat West Ham and West Ham are 11.0 to beat Liverpool, it makes sense to look at comparable matches where other teams carried similar prices in their respective home and away games in the past.
How to Calculate the HO/AO Quotient
As an example we will use the match Arsenal against Liverpool on 22/12/2017.
The evening before the match, the home win (Arsenal) was priced at 2.60, and the away win (Liverpool) at 2.95.
For the HO/AO quotient you simply divide the home odds (HO) by the away odds (AO).
2.60 divided by 2.95 = 0.881
That’s it!
Of course, if you would use the odds at kick-off then your quotient will be different, the home win (Arsenal) was then priced at 2.68, and the away win (Chelsea) at 2.95.
2.68 divided by 2.95 = 0.908
We will have closer look at these difference in the course of this article and explore if they actually matter and how much they matter.
What does the HO/AO Quotient Tell Us About the Comparative Strength of Teams?
When looking at the 2013-18 EPL HDAFU table, the following classifications become apparent when dividing games into ‘perceived strength’:
- HO/AO: up to 0.225
The home team is the clear favourite with a very good chance of winning (the home team is the overwhelming favourite)
For example, Liverpool vs. Brighton on the 13/5/2018 - HO/AO: 0.226 to 0.499
The home team is definitely stronger than the away team, but there is also a good chance of a draw in the game (fluctuating opinion between home or draw)
For example, Swansea vs. Stoke on the 13/5/2018 - HO/AO: 0.500 to 0.788
It is not really clear in which direction the game will develop (no overwhelming favourite)
For example, West Ham vs. Everton on the 13/5/2018 - HO/AO: 0.789 to 1.751
The chance of a draw is quite high as both teams are perceived to be of equal strength (no overwhelming favourite)
For example, Stoke vs. Crystal Palace on the 05/05/2018 - HO/AO: over 1.752
The home team is perceived as being much weaker than the away team; the public feels that it could be an away win (the perceived favourite is the away team)
For example, Southampton vs. Man City on the 13/5/2018
If you are in the possession of the 2013-18 EPL HDAFU table then go to the data tab and check a few matches and their HO/AO quotients and see if you agree with the games being in the above classifications.
Alternatively, calculate the HO/AO quotients using before kick-off odds that you can retrieve from any odds comparison site.
Now, continue with the exercise and check against the actual distribution of results. You will quickly see that they hardly distribute according to the expectations (HO/AO clusters). That’s what makes 1X2 betting so very tricky and the HO/AO quotient so handy.
Finding a System Using the HO/AO Quotient
We now come to the practical part of this article. If you have not yet downloaded our HDAFU Show Table, then you can do it now here; all the following examples are being carried out using this show table.
It is a fully functional table and its only limitation is that it is an expired table and cannot be used for the forthcoming season. Of course, it can be used for backtesting its functionality against the previous season (2017-18).
The size of this Excel .XLSX workbook is 4.2 MB
(1) Find an HO/AO Cluster in the ‘IP’s by HOAO’ tab in which the Curve Goes Steadily Upwards
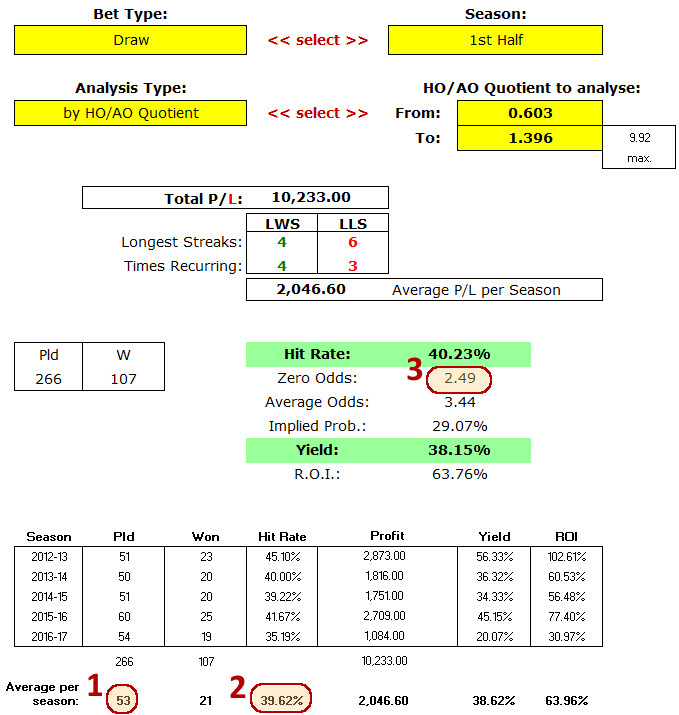
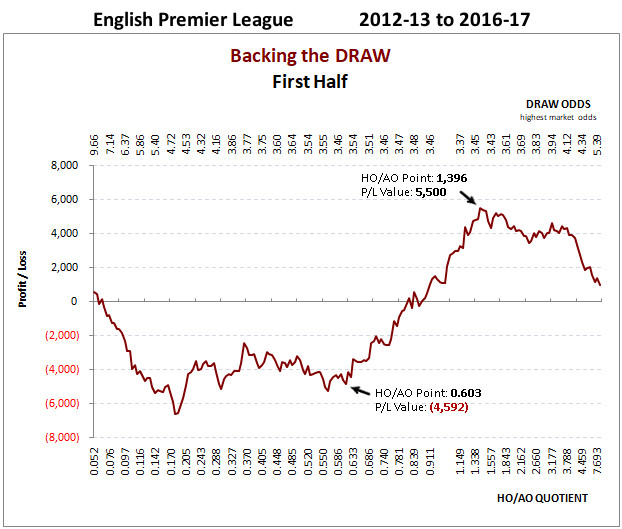 Image 1: P/L Simulation of ‘Backing the Draw’ in the first half
Above screenshot shows you ‘Backing the Draw’ in the first half.
It is a nice, steady upwards curve and stretched over almost a third of the whole graph. This is why we are going to look at this HO/AO cluster for this article.
(2) Check in the ‘System Picker’ tab what to Expect
Image 2: System Picker example- The expected number of matches to bet on the following season: 53
To diversify your portfolio, you are looking ideally for at least 500 bets in one season but you certainly want to avoid having too many small individual systems in your portfolio. Just remember, the more restrictive your selection criteria the higher the risk of deviation from the expectations.
50 bets in an individual system is a very good number (that means that you only have to identify 10 different systems to populate a portfolio with 500 bets in total), and even better if it has been achieved over all five previous seasons.
- The expected hit rate: 39.62%
Please keep in mind that the lower the hit rate the more volatile a system is to longer losing streaks. Here’s an article on that topic: The Science of Calculating Winning and Losing Streaks
If your system has a probability of 40% to win then the maximum length of a losing streak may be as long as 8 bets in a row.
Keep that in mind and try to avoid too many low hit rate systems in your portfolio.
As a side note, you will be expecting with this system a hit rate of 39.62%. However, it is very unlikely that it will be absolutely spot on. Compared with the hit rates of the previous five seasons the average fluctuation (deviation) expected is 2.55% but it may be even as high as the maximum deviation which in this case was 5.48%.
This is a risk measurement and I will address and explain the calculations and their interpretations in another article about ‘How to Construct a Portfolio’.
- The Zero Odds: 2.49
This is actually the most important figure when using the HDAFU Tables to determine if you take the system in your portfolio of bets or not.
Taking the expected deviation (2.55%) into account you are looking at ‘Zero’ odds between 2.34 and 2.65; even taking the max. deviation (5.48%) into account, the ‘Zero’ odds are still as low as 2.88.
In this example, everything above the ‘Zero’ odds of 2.49 was a value bet! If you would have aimed constantly for odds above 2.88, you would have been playing on the absolutely safe side.
As you are looking at a system with average odds of 3.44 (the figure below the ‘Zero odds’ in the above screenshot) the timing of your bet would hardly have mattered. Even if you don’t always have access to the highest odds in the market, e.g. because of territorial restrictions, then it would have been safe to include this system in your portfolio because of the likelihood of achieving draw odds above 2.49 (or even 2.88) ‘Zero’ odds.
Again, as previously mentioned, the calculations and their interpretations will be addressed in detail in another article.
(3) Decide if to Include the System in your Portfolio
Our example above was definitely a system worthy of inclusion in the 2017-18 portfolio. It had everything you would be looking for:
- 50 bets minimum per annum
- an acceptable hit rate and
- delightfully low ‘Zero’ odds for the draw
Feel free to check yourself how this system would have performed for you during the 2017-18 season.
Here’s the answer: In the end 55 bets were played, of which 21 won (38.18% hit rate) with a profit of over 1,500 units using 100 unit flat stakes.
Why does the HO/AO Quotient Make an Analysis Less Volatile?
Here’s a close up screenshot from the Inflection Point graph above (image 1) and the odds seem to be disorganised and unordered:
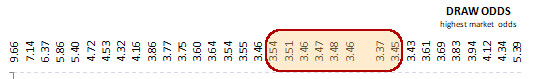 Image 3: Inflection Point graph – corresponding draw odds
The HO/AO Quotient is a device for grouping matches into ‘comparable strengths’ of the teams involved (home odds divided by away odds), with the draw variable removed.
If you would be picking your system by odds then draw odds up to 3.54 could be draws odds for all kind of matches; matches between a strong favourite at home, equally matched teams, or the favourite being the away team, and so on.
With the HO/AO Quotient in our example: 0.603 to 1.396 we are only targeting teams in group 3 ≫ It is not really clear in which direction the game will develop (no overwhelming favourite) and group 4 ≫ The chance of a draw is quite high as both teams are perceived to be of equal strength (no overwhelming favourite)
For example, if there is a strong favourite involved in the game then the HO/AO Quotient approach filters these games out, even if the draw odds may be lower than 3.54.
Using the HO/AO Quotient slims down the number of available bets to an average of 53 bets with an expected hit rate of 39.62%. The expected profit is: 2,046.60 units per annum when staking 100 units flat.
Would you have used the ‘IP’s by Odds’ instead you would have likely chosen the odds cluster from 3.30 to 3.65. This would have provided you with a higher number bets per annum (87) but with only a 33.33% expected hit rate and a lower profit expectation of 1,322.40 units. Furthermore, the system would have been more volatile: an expected deviation of 2.78% (as compared with 2.55%) with a maximum deviation of 6.66% (as compared with 5.48%).
By slimming down the number of bet candidates and targeting bet selection via the HO/AO quotient taking the strength of the teams into account, the system becomes less volatile.
Draw systems especially benefit from the HO/AO Quotient, but others as well.
At What Time Should the HO/AO Quotient be Calculated and Which Odds should be Used
All Summer and Winter League HDAFU Tables use 1X2 odds recorded at or close to the end of the ante-post market. In other words, just prior to kick-off in all games. In the majority of cases, these odds are courtesy of Pinnacle, the most popular low-margin bookmaker around. In all other cases, the 1X2 odds used are the highest bookmaker odds at www.Oddsportal.com from a selected panel of their bookmakers according to our own personal settings.
Ideally, the closer to kick-off you calculate the HO/AO quotients for your system(s), the closer you are going to be to the HO/AO quotients calculated and used in the HDAFU simulations. Preferably, you should wait until team news is released before relying on where the odds settle thereafter.
Calculating the HO/AO Quotient at another Time
If you are for some reason unable to calculate the HO/AO quotient close to kick-off on match days then please, don’t worry too much.
Here’s an example weekend from the first half of the 2017-18 EPL season:
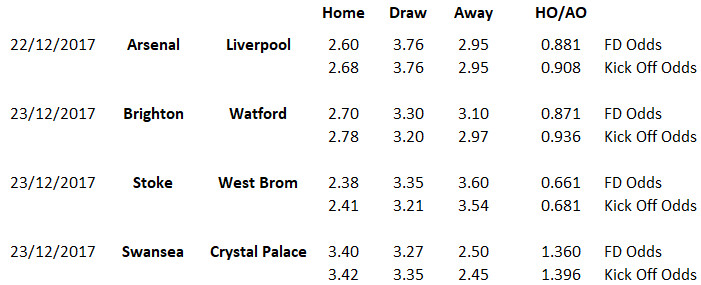 Image 4: Calculating HO/AO Quotients at different times
As you can see all four matches that would have fitted the criteria of being in the HO/AO 0.603 to 1.396 quotient cluster would still have been in the group of betting candidates even when using odds at the close of the match.
Only the Swansea vs. Crystal Palace match may have drifted out of the cluster. The other three games remained solidly within their clusters so that it didn’t matter at all how their odds changed during the ante-post market.
I hope this article has cleared up any confusion caused by the introduction of the HO/AO Quotient to our 7th generation HDAFU tables. However, if you are still not sure, then please feel free to ask any questions via the comment section below.


Hi Soccerwidow
Thank you for clarifying my previous question regarding the Lay process.
Just for clarity, and I have read the other posts too, but a little doubt remains. If the odds of game drift or drop in to the required Quotient 4+ hours prior to KO, do I include this bet, or should I exclude it due to market volume driven by sentiment or market manipulation by Traders on exchanges?
Thank you, once again.
Mike
Hi Mike,
the main advice I gave in Judging the Risk of a Football Betting Portfolio was to stick to the Rule of Thumb: 50 is the magic number!
This included.. At least 50% of the systems within the portfolio with at least 50 bets (for the whole season/year).
If you find enough systems that have 50 (at least close to 50) bets in a season/year then your worry becomes obsolete because the span of the HO/AO quotient is going to be big enough to cover deviations that may arise through odds movements prior kick off.
In addition, odds only start moving seriously in the last hour before kick off.
Choose your bets according your set criteria on Thursday or Friday for the weekend, and then place them at any time you like without worrying if the HO/AO quotient has changed by the time.
Hi,
just out of curiosity can you explain how did you get the expected min and max odds in portfolio tab lets say for the England EPL which range from 3.36 to 3.54.
If i input the same system in the free England HDAFU table the corresp.odds are from 3.46 to 3.50, even if i manually scroll through the clusters the odds range from 3.21 to 3.56 so i’m not sure where is the difference.
Just for clarification for other readers… This question refers to Image 2 (System Picker example) if you replicate this screenshot in the free download in the ‘System Picker’ tab.
In this particular example…
Cell L12 (Corresp. odds from) takes its information from Z214 from the ‘IP’s by HO/AO’ tab
Cell L13 (Corr. odds to) takes its information from Z267 from the ‘IP’s by HO/AO’ tab
If you go to the ‘IP’s by HO/AO’ tab and look at the cells Z214 to Z267 you will note that the corresponding odds first decline up to a minimum of 3.30 (HO/AO: 1.000) and then start rising again.
This is because the cluster 0.603 to 1.396 includes (more or less) ‘equally matched teams’ with home hodds from 2.26 to 3.35 and away odds from 3.72 to 2.4. At some stage (HO/AO: 1.000) there is a tipping point when the team favorited to win at home becomes the underdog and vice versa.
If you manually look up the odds range you’ll find 3.21 to 3.56; the explanation is that the ‘IP’s by HO/AO’ tab displays averages for the associated HO/HO group.
Hope this clarifies your question…
However, please don’t pay too much attention to the ‘corresponding odds’ display in the ‘System Picker’ tab. This information was only included to give users an idea what the HO/AO clusters actually mean as it’s a concept that probably surpasses the common knowledge of the average punter.
Hi Soccerwidow
I’m loving your work and appreciate the time and effort placed in all of your Tables, article…just the whole site!
What I’d like to ask, and I’m not sure if I have read it before, so forgive me if it has been answered previously is this:
Have you ever recommended Laying Systems rather than Winning? My example is based on say the EPL (Demo) whereby HOAO Q @ 0.622 and 1.396 have achieved an average “loss” of £1416 with a LLS of 17 vs LWS of 4.
Of course using this a Laying System it would appear that we would have achieved a winning streak of 17, and losing streak of 4!
With such powerful information to hand, I’m wondering whether there is equal opportunity to be had using the Lay method, or am I perhaps viewing it from a different vantage point.
Thank you once again and look forward to hearing from you.
Hi Mike,
yes, of course you can use the information in the tables for identifying laying systems instead backing. Exactly as you describe.
It’s just writing high quality articles like we do takes a huge amount of time and many of our readers don’t have access to exchanges. Therefore, we have decided to concentrate on writing about backing for the time being. Once, we have written and published everything what there is to write and to publish we will look at writing about laying. But this is probably only going to happen sometimes next year. We are even thinking about developing ‘Lay HDAFU tables’ in addition to the tables we are offering now.
Our HDAFU tables are hugely powerful! I simply cannot write quick enough and explain everything.
Hi do the HO / AO quotients have a benefit or value on over under betting systems or does it only assist in HDAFU selections?
The HO/AO quotient is very powerful. The Over Under course and the Over Under tables fully utilise the quotient.
Here’s a good introductory article: Over/Under Goals Market – Betting with Cluster Tables
Read more here: our articles on Over Under betting
Hi,
Thanks for this article that cleared up a lot of things for me.
I have a few questions:
1.How was the average fluctuation of 2.55% derived?
2. How was the maximum deviation of 5.48% derived?
3. How were the zero odds range of 2.34 and 2.65 derived?
Hi Tom,
the hit rate observed in this particular cluster (0.603 to 1.369) was 40.23%.
1 divided by 40.23% = 2.485707184 (Zero odds: 2.49)
Regarding you ‘fluctuation’ (deviation) question… Please look at image 2, where I marked the hit rate with ‘2’.
39.62% average hit rate.
Highest hit rate in the last 5 seasons: 45.1%
45.1% minus 39.62% = 5.48%
If you calculate the deviation from the mean for all 5 season and then calculate the average of them (Please pay attention only to use the absolute figures; meaning removing the negative signs) your result will be as follow:
(5.48% + 0.38% + 0.4% + 2.05% + 4.43%) / 5 = 2.548% (rounded: 2.55%)
If you would like to understand more about deviation and ranges and other mathematical and statisctical terminology that is applicable to betting then you may be actually interested in our course book: Fundamentals of Sports Betting
Hi Soccerwidow,
probably not the best question but just to be clear.
“Betting odds for weekend games are collected Friday afternoons, and on Tuesday afternoons for midweek games.”
weekend games = games on friday, saturday, sunday and monday?
And then another question: I’m new to predicting odds movement and therefore I thought about just placing the bets on tuesday and friday evenings to be really close to the capture point. Most likely not the optimal point in time for placing bets but do you think it will work?
Thank you in advance and greetings
Lukas
Hi Lukas,
timing is NOT important! Odds move pretty randomly between opening and closing and they are often higher in between but there isn’t any exact rule of any ‘best timing’.
The only thing that is observable is that odds for favourites at home have the tendency to get shorter closer to kick-off and odds for the draw show a tendency to shorten for HO/AO quotients above 0.500. But again.. I said tendency… that doesn’t mean all of them.
Yes, weekend games = games on Friday, Saturday, Sunday and Monday
I recommend to place bets the day before a match; times pretty randomly, whenever you have the time. I’ll write an article about odds movements and timing of bets but this will be probably much later this month.
Just a a side note, if you don’t find an article that is close to your question and your question relates to the HDAFU Tables, then please use the comment section of our FAQs: Frequently Asked Questions – Make the Most of Your HDAFU Tables. This will help others to find answers and it helps me to plan articles on topics that interest readers and users of the HDAFU Tables.
Soccerwidow
The reply option to your last comment in our discussion is not available, hence making a new comment.
Thanks for your suggestions. I will certainly take them on board. One thing you mentioned stood out to me, and that is the relationship between a systems hit rate and it’s yield. Is there a rule of thumb you follow yourself when assessing whether the yield is acceptable for the given hit rate? What should we be looking for?
I’m writing on that article right this very moment. I hope that I will be able to publish tomorrow.
Yes, there are rules.
Hi Simon, I just published the new article 🙂
Judging the Risk of a Football Betting Portfolio
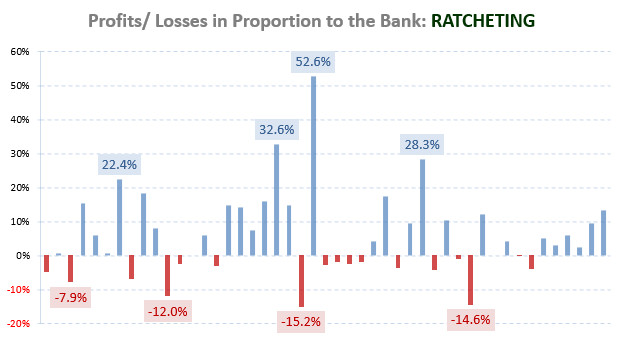
Uff! This was a laborious job!
Next article about starting a portfolio in the mid of a season… and then success report of the 2017-18 portfolio and an article about staking & ratcheting.
Hi,
as I understood from one comment, in IP’s by HO/AO tab favourites have one same graph for home and away favourites and it’s the same for underdog teams. for favourites, the graph starts with showing the smallest odds recorded over 5 years and those odds gradually increase moving from left towards right side of the graph. then at one point odds reach the highest point for the favourites and then odds start decreasing again, indicating these are for away favourite teams now. For underdogs, it’s vice versa, and at the very left of the graph the highest odds recorded over 5 years are shown and they decrease gradually towards the right side of the graph. at some point they reach the lowest point and then start increasing again, indicating these odds are for away underdog now and I would be betting on away underdog.
I found one underdog graph where profit curve starts increasing in home underdog side, and continues to do so when shifted to away underdog side of the graph. I’m confused, to me it means there would be certain HO/AO values I should bet on for home dogs and other, different values of HO/AO quotient for away dogs. However, how do I find out, what values are for home dogs, what are for away dogs?
Hi jo,
here are a few examples…
Chelsea vs. Sunderland H: 1.20 A: 26.00 HO/AO: 0.046
Hull vs. Tottenham H: 7.00 A: 1.60 AO/AO: 4.375
Man United vs. Crystal Palace H: 2.60 A: 3.19 AO/AO: 0.815
HO/AO equals 1.000 := Totally equal teams
HO/AO less than 1.000 := Home favourite, away dog
HO/AO greater than 1.000 := Home dog, away favourite
Hi Soccerwidow,
I’m still confused
HO/AO less than 1.000 := Home favourite, away dog
HO/AO greater than 1.000 := Home dog, away favourite
In that particular graph I have HO/AO quotients greater than 1.000 and that part is no longer “left” side of the graph, but already “right” side, so it should be away underdog, however your explanation suggests it’s away favourite. And when I look at the odds lined up straight above HO/AO quotients, they are named “UNDERDOG ODDS highest market odds” it’s clear they are underdog odds, there is no way a team with odds of 4.00 is a favourite, although HO/AO quotient below odds of 4.00 is about 1.70. I still don’t understand something…
Hallo jo,
it seems that you’re looking at the graph on the very right. This is the ‘Backing the Underdog (home & away) graph.
There are actually two graphs: favourites and underdogs. One graph simulates profit/losses on favourites only (second to the right) and the other on underdogs only (right).
Please scroll down in the ‘IP’s by HOAO’ tab to row 254 and there pay attention to cells AX253 (favourites) and BJ254 (underdogs).
AX253 is the maximum favourite price (odds); everything above and below is decreasing. This is the turning point at HO/AO = 1.000. This table contains favourite odds only, it doesn’t matter if they play home or away.
HO/AO less than 1.000 := Home favourite
HO/AO greater than 1.000 := Away favourite
BJ254 is the minimum underdog price (odds); everything above and below is increasing. This is the turning point at HO/AO = 1.000. This table contains underdog odds only, it doesn’t matter if they play home or away.
HO/AO less than 1.000 := Away dog
HO/AO greater than 1.000 := Home dog
Hi soccerwidow,
Thanks for your reply. I couldn’t seem to continue the discussion below so had to create a fresh post.
I don’t think I put my question to you before as clear as I could have. Thus I’m still uncertain about something. I could be misunderstanding something, so apologies if that’s the case.
My understanding is that all the hdafu tables are based on odds that are recorded Friday and Tuesday afternoon. So on that basis if a round of games occur on a Sunday, I can calculate the ho/ao quotient for those games on Friday evening and be assured that the quotients are as accurate as can be. Then I can place the bet with the bookmaker whenever I want and preferably at the time when I get the best odds.
The point that is leaving me confused is that it isn’t the case that all tables are based on Friday and Tuesday afternoon odds. Some are based on closing odds. So for those tables based on closing odds I’m asking myself, “Should I be calculating the ho/ao quotient at a comparable time to when the odds were recorded?”
So my question here is for a league such as Austria, that has odds in the table based on closing odds, can I calculate the ho/ao quotient a few days before the game? Or to ensure a like for like comparison do I need to do this just prior to kick off?
That’s where I want to be clear in my mind what the purpose of contracting down the odds clusters at either end of the ho/ao quotient range is as mentioned in the reply to Matt. Is it a modification to be applied to just the tables that’s odds are closing odds?
I suppose I could ask the question another way, regardless of whether closing odds or Friday/Tuesday odds, can I calculate the ho/ao quotient 2 to 3 days before a game in any league and be confident that the matches showing up within my ranges should indeed be there?
Thank you.
Hi Simon,
yes, you can calculate the HO/AO quotient 2 to 3 days in advance. It doesn’t matter if the HDAFU Tables were based on odds recorded Friday and Tuesday afternoon or closing odds (Oddsportal).
Although the odds change prior to kick-off they don’t change hugely. A favourite doesn’t become an underdog or vice versa, all of a sudden.
Just look one more time at the percentiles in this article for the 2013-18 EPL HDAFU table, and the five groups that become apparent when dividing games into ‘perceived strength’:
HO/AO: up to 0.225
HO/AO: 0.226 to 0.499
HO/AO: 0.500 to 0.788
HO/AO: 0.789 to 1.751
HO/AO: over 1.752
Each group contains 380 matches (1,900 divided by 5). The range of the HO/AO quotient for the group ‘equally matched’ (0.789 to 1.751) spans at 0.962.
I’m sorry if showing three decimal points for the HO/AO quotient causes confusion.
Basing your strategy on the HO/AO quotient helps you to identify profitable value bet ranges. Of course, you may miss a game or two on the outskirts of the range but these bets may be losers, you never know. You’re playing statistics! Never forget that.
Hi soccerwidow,
Thanks for your explanation.
The part of your reply to Matt, regarding finding potential systems; you metion to establish the ho/ao quotient and then remove the clusters at the top and bottom end of the range. What is the purpose of this? And is it something I need to be doing for all my systems?
Hi Simon,
I’m a very risk-averse person and do not like gambling on uncalculated risks. To reduce the group of potential bets – cutting the top and the bottom of the range – is a risk management measure to reduce uncertainty. I don’t know what systems you have picked but if you can cut the bottom and the top without reducing the groups too much then do it, especially with the high risk groups.
I will explain risk management and portfolio building in more detail when we publish the winter league campaign that is currently in preparation.
Soccerwidow,
All points duly noted. Thank you.
I will be looking forward to the winter league campaign you are publishing. Is that going to be the actual portfolio you intend to use yourself this season. Or the one you used last season? Actually seeing how you have compiled a portfolio using the ho/ao quotients and being able to understand the reasons behind it would be hugely beneficial in compiling our own portfolios. I find the analysis is the easy part, but where I and perhaps others may struggle is the actual “putting it all together” part.
I have analysed 14 leagues myself and picked out a shortlist of what I believe to be the best systems. The difficult part, and what I find overwhelming to a degree is deciding what is the “best” system from any given league, and more so, what is the optimum set up for a portfolio. In some leagues analysed there are multiple systems with large profits, good yield, good number of bets, consistent hit rate and profit from season to season. Which one to pick? I suppose your article will address that, so I will save any detailed questions for then.
Thank you.
Hi soccerwidow
I’m already having a hard time accepting that for the tables based on oddsportal closing odds we can calculate ho/ao at any other time than at kick off. I’ve already seen two home teams in Poland change from a home favourite to a home underdog in 2-3 days prior to kick off – and that’s 1 league in 1 weekend. All the strategies for the extra leagues are based on closing odds so surely we have to calculate ho/ao quotient at the time the odds are recorded. Otherwise the whole exercise has a random variable thrown in to it unnecessarily.
Hi Simon, the swap between being a favourite at home and then suddenly the underdog only happens when the odds for home and away are very close.
You are on the safer side if you avoid favourite and underdog strategies with an HO/AO quotient between 0.92 and 1.08. In these cases it’s better to look for a home win or away win strategy. Then it doesn’t matter if they ‘swap’ direction.
Another thing is to look for longer sequences like I’ve shown in the EPL 2012-17 example. Something that is going on and on and on. I picked the EPL draw 1st half for the article because the curve for the whole season was pretty similar and the results were only slightly distorted by the second half. It was an easy example, otherwise I would have had to expand upon the explanations in the article in much greater length.
Just as a rule of thumb… If first and second half show totally different curves (e.g. one going up the whole time, the other goes down) then it may be an anomaly you are observing. Stay away from these bets or if you decide to include them, then make sure that you don’t have too many of them in your portfolio.
By the way, Poland is a very difficult league. I have no explanation why they show such erratic results. The differences between the first and second halves are huge. You will only find there high risk systems (with a probability of 30% and lower) that you will have to balance out with other leagues.
Soccerwidow,
Yes I noticed the systems in the 1st half tend to be profitable and in the 2nd half not at all.
I narrowed down my choice in Poland to a home win or an underdog system exclusively for the first half. I opted to go with the home win system.
So you can see what the specifics are, the ho/ao quotient is 0.858 to 5.552. Profit is in 4 figures for all prior 5 seasons, hit rate 39%, 58 betting opportunities expected. It ticked all the boxes.
Having to wait to place bets at kick off is not an issue for me. I just want to replicate the conditions when the odds were recorded. But, is this not a good system in the harsh light of day?
I would split and monitor this group into two:
0.858 to 1.468: 39 bets expected, 15 wins, Yield 17.14%, hit rate expected 38.46% >> yield is too low for this medium risk hit rate: probably better half stakes only
1.468 to 5.552: 19 bets expected, 7 wins, Yield 72.57%, hit rate expected: 36.84% >> yield is a little bit too high to be true but I would probably give it a try with full stakes as you will still be in profit, even if there are only five bets winning (of 19)
Regarding staking… there will be an article soon.
Regarding placement of bets… Home odds in your chosen cluster behave pretty randomly before kick-off… Some go up, others go down. There isn’t a clear pattern. Therefore, the time to place the bets doesn’t really seem to matter.
Simon, can you please wait for another few days for system discussions and what exactly to pick? I’m right now in the process of finishing the article about compiling a portfolio and questions like this will be there much better placed.
With the new format once we have identified a HO/AO range are we likely to see cases where the odds for the bet fall outside the corresponding odds range even though the HO/AO quotient for a particular game is within our target range?
Hi Darren, yes it is not unlikely that the odds for a particular bet fall outside the ‘corresponding odds’ range, especially if you are looking at bets close to the outsides of the HO/HO range. The corresponding odds are just average odds for a group of bets in the particular HO/AO cluster. Please also see my other reply to your earlier question.
Once potential systems are identified using the HO/AO Quotient would we just use the calculated HO/AO for the particular game, or also ensure it also falls withinthe corresponding odds?
So for example, If the system identified a HO/AO range of 0.592-0.721 and the corresponding odds were 3.35 – 3.73 with the zero odds at 2.44 and a particular game had a quotient of 0.65 but the odds were 3.25 would that exclude that bet? Or is unlikely to happen that the odds wouldnt fall within the corresponding odds if the HO/AO quotient is within the range?
I assume that the ‘corresponding odds’ you’re referring to are the odds you find in the ‘IP’s by HO/AO’ tab or in the ‘System Picker’ tab. These are average odds. Their only purpose is for guidance to help people to get to grips with the HO/AO quotient and understand them better, and also for display on the graphs. Nothing else.
For example, if you take the 0.603 to 0.611 cluster from the EPL 2012-17 sample table, the ‘corresponding odds’ for the draw are 3.50 but the group includes 12 matches with following draw odds:-
25/08/2012 Southampton vs. Wigan >> 3.53
12/05/2013 Norwich vs. West Brom >> 3.50
04/12/2013 Swansea vs. Newcastle >> 3.55
23/03/2014 Tottenham vs. Southampton >> 3.50
13/09/2014 Crystal Palace vs.Burnley >> 3.35
05/10/2014 Tottenham vs. Southampton >> 3.55
31/01/2015 Sunderland vs. Burnley >> 3.40
22/03/2015 Liverpool vs. Man United >> 3.55
13/02/2016 Crystal Palace vs. Watford >> 3.33
02/04/2016 Norwich vs. Newcastle >> 3.44
10/12/2016 Swansea vs. Sunderland >> 3.57
18/12/2016 Man City vs. Arsenal >> 3.74
As you can see, there were 12 matches in this group with an odds range spanning 3.33 to 3.74.
Therefore, you can safely disregard attention to ‘correct odds’. Look only to see that the particular game you are analysing has its quotient within the targeted HO/AO group, e.g. 0.65, and then look to see if its odds, e.g. 3.25, are over the calculated Zero odds (2.44). Try to stay above the zero odds, which will be achievable in most cases.
So far looking at the HO/AO method I have analysed 10 leagues during last week and this weekend. The new design for the tables has made quick analysis of areas of interest on the inflection graphs possible now. So, it’s great that I have been able to get through so much so quickly.
One thing I noticed during the analysis is that, taking the “favourite” graph for example, we see that to the left hand side of the graph you have small HO/AO quotient which increase towards the other side – which indicates home favourites one side of the graph, and away favourites on the right side of the graph. On most of the favourite graphs I have seen that there are profitable sections for home favourites, and profitable sections for away favourites, but nothing in between.
Under the inflection points by odds approach, the profitable odds clusters for home favourites would be mixed in with the profitable odds clusters for away favourites. But with HO/AO we see profitable home and away favourites separated. Also, the advice given last campaign for the inflection points by odds approach was that we should choose only one system per league – due to the fact that they would compete with each other.
Would the advice change now with the HO/AO approach? Can we take different HO/AO ranges from the same bet type? If we do so we know they cannot overlap. Of course, if the systems are from different bet types then they HO/AO ranges could clash.
Your feedback would be greatly appreciated. Thank you.
Hi Simon,
you have on the top of the HO/AO graphs the corresponding average odds. This will give you an indication at what odds groups you’re looking. An yes, you are right, with HO/AO we see profitable home and away favourites separated.
The advice that was given last year is still valid… to avoid wild rides (too long losing streaks) make sure that you don’t have two systems in your portfolio that are connected with each other. So, if you are picking by HO/AO quotient then you can look in the same league for another system but, if possible, not with overlapping HO/AO quotients. With that you will make sure that you won’t target the same groups.
However, if you are targeting the same HO/AO quotient (or have any overlapping) then check against the past results if the two systems would have balanced each other out. Just avoid by all means to double your losses if the teams don’t play to expectations for a while!
Hi, I’m contemplating buying the new tables, but before that I have a few important questions. Can you please answer them?
1. As far as I understand, the focus has now been shifted to the new HOAO method. Does that mean that you don’t recommend using systems based on the standard odds anymore?
2. Are the odds in Oddsportal reliable anymore? Can I continue to use this site to calculate the HOAO quotient or should I use FootballData?
3. How exactly do I calculate the HOAO for the matches? Must I divide the highest home odds of all bookmakers for a particular game by the highest away odds of all bookmakers, or must I divide the highest bookmaker’s home odds by the same bookmaker’s away odds?
4. What about the odds of the “strange” bookmakers like 1Xbet and Marathonbet? Should we continue to ignore them and discard them from our analysis?
5. Have I understood correctly that it’s enough to check the HOAOs of all the matches in my leagues at Monday evening and Friday evening, place all the qualifying bets at these times, and forget about them for the rest of the weekend?
Thanks.
1. The new tables have both, the HO/AO quotient and the Odds inflection point graphs. It’s just that we haven’t yet found the time to write more articles and produce a few explanatory videos. The HO/AO Inflection Point graphs are an addition to the HDAFU Tables, not a shift.
The really big shift that we are actually doing with the new tables is not the introduction of the HO/AO quotient but moving away from kick-off odds to odds collected well in advance; We are moving to the odds that are closer to the odds originally published by the bookmakers and that are therefore closer to the real (statistical) expectation of the outcome of the match than kick-off odds that are influenced by team news and market pressure.
2. Oddsportal is as reliable as they always were. We just used for the new HDAFU tables FootballData data not only to save us the time to compile kick-off odds manually but also because odds before kick-off are quite erratic and take market pressure much more into account than odds that are taken well before kick-off.
To calculate the HO/AO quotient you can use any odds comparison site as long as you avoid calculating the quotient too close to kick-off.
3. Divide the highest home odds of all bookmakers by the highest away odds of all bookmakers. It will be hardly the same bookmaker as they all have an overround and you want to exclude that.
4. 1XBet and Marathonbet are only “strange” prior kick-off.
Those two are “problematic” because the odds shown on Oddsportal are usually so far and above the rest of the competition that they distort the picture. Because of the disparities, the highest odds across the board became overloaded, showing an arb opportunity in almost all matches. Therefore, all the scraped Oddsportal (kick-off) odds were audited to exclude both firms.
The other problem is the fact that the odds shown on Oddsportal are hardly ever available on Marathonbet or 1Xbet – Okay, they are both low-margin concerns, which might mean their prices jump around a lot faster making it a struggle for Oddsportal to keep up, but the price differences are sometimes difficult to understand.
For the sake of analysing systems (just before kick-off) we have told everyone to exclude Marathonbet and 1Xbet, but of course, if you can get a better price at one of these two bookies then they are certainly okay to use them to place the bets.
5. Yes, you understood correct. It will be enough to make your bet selections for your portfolio on Friday evenings and Tuesday evenings (sorry, not Mondays… this was our mistake; we are in the process of correcting that wherever we published it). FootballData odds are taken Friday afternoons for weekend games and Tuesdays afternoon for midweek games.
The new tables (not only the HO/AO quotient) remove the time pressure from having to select bets close to kick-off. However, that doesn’t mean that you don’t have to pay attention of choosing the best timing of your bets to get the highest prices possible and some of them maybe actually just before kick-off. There will be an article on that topic coming soon.
Hi,
when i was comparing the HDAFU charts you use with the max odds from footballdata and the HDAFU charts i made myself using either the pinnacle closing odds or the pinnacle odds recorded at the same time as the max odds you use, i realized profitable hoao-ranges occur much less often with pinnacle.
Since im trying to only use asian bookmakers, 1xbet or marathon arent really what im aiming for, which is why i created the chart myself with pinnacle.
My thought would be, that only focusing on one bookmaker during this whole process would lead to more confident results.
When doing this, what would you rate as better: Using the closing odds for the chart and betting shortly before kickoff, or using the other ones (recorded on friday and tuesday afternoon). Id assume theyre much more volatile when it comes to being recorded as well as the time to kickoff (friday->saturday, friday->monday)
A following up question: Would you think its worth calculating matches using the ValueBDetector or the HOAO-Cluster approach, but checking if they fall into a profitable HDAFU-Cluster before placing the bet?
Hi Matt,
If you use one bookmaker only, e.g. Pinnacle, then you’ve got an overround of around 4-5% in your calculations. This is taking away the whole profit and thus you see less profitable HO/HO clusters.
Neither 1xbet nor Marathonbet are included in the HDAFU tables. The query you’re referring to relates to the old tables that were using closing odds to simulate the Profit/Loss curves and these two bookmakers were ‘problematic’ because of their prices ‘jumping around’.
Don’t use closing odds for the chart; they are too erratic.
Yes, it makes sense when you use the VC and identify bets to compare them with the profitable clusters in the HDAFU tables. This is actually how the HDAFU tables developed. It was the time as I was writing match previews for Betfair and needed to publish value bets that would produce a long-term profit to the followers of my articles.
Alright thank you,
you said you are using footballdata, which is the main site for most things i do aswell
footballdata currently has “main leagues” and “extra leagues”…while they collect odds data from friday and tuesday for the main leagues, they dont do it for the extra leagues (only closing odds)… but you are still selling tables for romania, denmark etc. which are considered “extra leagues”… so are you taking the closing odds for the “extra leagues” or how did you do it?
you said 1xbet and marathon are not included… when using oddsportal its easy to disable them, but football uses betbrain odds and betbrain features 1xbet
thank you again for you time 🙂
Hi Matt,
we have used Football-data only this year and here’s more information about their odds and recording times: http://www.football-data.co.uk/notes.txt
As the odds for the ‘normal leagues’ are collected well in advance (Friday afternoons for weekend games and Tuesday afternoons for midweek matches) 1xbet is not distorting them. This problem only occasionally arises very close to kick-off.
However, for the ‘extra leagues’ Football-data uses Oddsportal highest odds and bookmakers that distort the picture there regularly can be dismissed when carrying out the HO/AO bet selection calculation. (Usually only 1Xbet and Marathonbet are a problem)
There is an article in the pipeline on the difference between ante post odds well prior to kick-off and closing odds, especially when choosing the best time to place a bet. However, you are probably more interested to know the effects when using the HO/AO quotient.
It’s up to you if you wish to identify a system by odds or HO/AO Quotient. It’s just that the HO/AO Quotient is far less volatile than compiling a system by odds. However, to be on the safe side when using closing odds (extra leagues) disregard the HO/AO quotients to the left and to the right of the chosen group (i.e. the clusters at either end of the scale).
To identify these, once you have chosen your system (whole season, 1st half or 2nd half), scroll down the ‘IP’s by HO/AO’ tab and find the rows in the table relating to your chosen cluster. There, discard the highest and lowest cluster rows; thus, reducing the cluster size (i.e. contracting it by one step down at either end).
This, of course, reduces the available potential bet candidates but safeguards you from including outlier bets in your portfolio (due to odds movements) where the HO/AO quotient variations may actually see the bet fall outside the profitable cluster.
Bear in mind the main rule in betting: Better safe than sorry! Don’t include bets in your portfolio if you’re not sure.
Hi Soccerwidow,
Just catching up on any new info and wanted to clarify the point raised by Matt and it’s effect on bet placement. I understand that the main leagues on football data have their odds captured on friday and tuesday afternoons. I wasn’t aware that the odds for the extra leagues were collected at kick off – which of course will affect bet placement and perhaps end up with bets not being in the HO/AO quotient range if we bet early for these leagues.
So I see that the extra leagues are those such as Poland, Denmark, Russia, Switzerland, Austria, and one or two others.
You mention to take this odds recording time into account in the bet placement process by contracting down the cluster range by one cluster at each end of the scale, which makes sense.
Is this modification just for the extra leagues? Or do you advise making the same modification to the normal leagues too?
Thank you.
Hi Simon,
Bet placement and choosing the bets (compiling a portfolio according to a set selection criteria/ system) are two completely different pairs of shoes.
At the moment, we are speaking about bet selection (identifying profitable clusters to bet on with the goal of compiling a portfolio of bets).
Say, you would have identified using the HO/AO quotient in the EPL 2012-17 HDAFU Tables (with closing Oddsportal odds) a system to Back the Draw if the HO/AO Quotient is between 0.756 and 1.382.
Contracting the range by one cluster on each end of the scale would have reduced the cluster to 0.764 to 1.354.
If you had used Football-data odds (the Friday and Tuesday afternoon odds captures) you would have probably chosen the range from 0.603 to 1.396 (as shown in the article above).
You can see in this example that with the Oddsportal closing odds you would have had a more restrictive selection criterion than with the Football-data odds but you would still have been safely within the ‘permitted’ range (‘permitted’ meaning that the odds were captured well in advance).
By the way, the Oddsportal range delivered 2017-18 a profit of 1,391 units (33 bets; 42 unites per bet) and the Football-data range a profit of 1,509 (55 bets; 27 units per bet).
In this example the Oddsportal range was more efficient and easier on the nerves than the other range but please don’t take this as a rule of thumb.
The HO/AO Quotient allows you to compile your portfolio well in advance of a match (as I showed in the example, it doesn’t matter if it’s an ‘extra’ (Oddsportal odds) or ‘normal’ league) but for the best time to place the bets that’s a completely different question. There will be an article on that shortly.
Hi,
if I will use oddsportal to calculate HO/AO quotient. Are bookmakers like 1xbet and marathonbet good to use, although earlier they were rated as “problem” bookmakers?
Hi Jo,
1xbet and Marathonbet are ‘problem’ bookmakers if you look at odds close to kick-off. Their prices jump around a lot faster than other bookmakers and hence, making it probably a struggle for Oddsportal to keep up with that. Another problem is the fact that the odds shown on Oddsportal are hardly ever available on Marathonbet or 1Xbet. Please bear in mind that I’m talking about odds very close to kick-off.
These two bookmakers were problematic with the old HDAFU tables as these were based on odds close to kick-off. Now, the HDAFU tables are using ante post odds that aren’t kick-off odds and these two bookmakers don’t present a problem then. Their odds don’t make the jumps as prior kick-off. Therefore, when calculating the HO/AO Quotient you don’t need to worry about those two bookmakers.
I hope this makes sense.