Fundamentals of Sports Betting (Betting on Over/Under ‘X’ Goals) is unlike any other book you will find elsewhere. It contains insights into how mathematics and statistics are applied to bookmaking, information that is rarely (if at all) found in the public domain.
Have you ever wondered how bookmakers set their odds? They must be pretty good at it to remain trading in a high risk industry built on small margins!
 Remember folks it’s all about finding the “edge”.
Image: Cartoonresource (Shutterstock)
It is common knowledge that the gambling industry as a whole relies to a large extent on the ignorance of its customers and, only by understanding how bookmakers think and act, will you ever be able to compete with them on a level playing field.
The Most Valuable Book About Betting You Will Ever Buy!
This course is designed to give you the essential, fundamental knowledge necessary to understand odds calculation and the bookmaker market.
It deals with relatively simple descriptive statistics and teaches you how to look at data sets, calculate your own probabilities and odds, analyse the market odds on offer, and make informed decisions when predicting football results.
Amongst the topics you will work through are distributions, deviations, graphs and charts, odds calculation, financial terminologies, risk management, and of course, how to identify ‘value’ in the betting market.
You will gain a deep understanding of the many different elements required to understand the bookmaker market and odds calculation. Many false beliefs that the majority of gamblers and fans of football have about betting will be exposed and stripped away.
Readers will also be enlightened to learn about how odds are set in the market, where to find ‘errors’ in market prices, how to evaluate data and graphs, and much, much more.
What Do You Get For The Money?
The course comes in electronic format and the bundle includes the course book (PDF*) and a Bundesliga cluster table (Excel) for studying. This course employs a didactic method of teaching, which is an educational technique. It is a very structured style of learning and as such, each section of the course should be mastered before moving on to the next.
To further encourage you to learn, there is a plethora of exercises to practice what you have learned, and the solutions to the exercises are found at the end of the book, sometimes embellished with further explanations.
All of the course lessons are presented in a pragmatic, easy-to-follow, step-by-step fashion, with no more than passing respect towards the sport of football and the passion of its fans. After all, this book has been written by a lady who loves maths but dislikes football…!
In addition, you will receive the very latest Bundesliga table for the current season, so that you can put into practice what you have learned and within the course, you will find a discount code enabling you to download for free the German Bundesliga sheet in future seasons, meaning that you will always have access to the most current Bundesliga cluster table, forever: it doesn’t matter when you bought the course.
*By the way, the PDF is a professionally formatted document and if you have a double-sided printer you can print your own book for studying.
Fundamentals of Sports Betting
Course with Cluster Tables for the German Bundesliga
Over/Under ‘X’ Goals
PRODUCT SUMMARY

- Format: PDF & XLS
- Download Size: Course (PDF): 5.2 MB & Excel file: 782 KB
- Publisher: Soccerwidow Ltd; 2nd Edition (July 2016)
- Pages: 169 (almost 38,000 words)
- Tables and graphs: 70
- Example tasks: more than 80 (with solutions)
- Language: ENGLISH

PDF document professionally styled for easy reading and printing
For traditionalists, the PDF has been professionally formatted for double-sided printing. If you like, you can print your book in full-colour with a cover and add slick spiral binding.
Those who prefer to read the document on their computers will find the chosen font (Myriad Pro) easy to read on the screen. Myriad Pro has a clean sans-serif aesthetic which makes it highly accessible.
The electronic version also contains a plethora of easy-to-navigate links to help the learner find his way around the document.
Contents at a Glance
Section A: Basic Knowledge
Probability, Betting Odds, Value, Yield, Profitability
Basic Statistical Terminology
- Goal Distribution and Percentage Calculation
- Deviation from the Mean
- Standard Deviation – The Main Measure of Variability
- Precision, Trueness and Accuracy
Betting Odds Calculation
- Probability and Betting Odds
- Opening Betting Odds Range
- Calculation of ‘Zero’ (Fair) Odds
Risk Management Control
- Financial Terms: Yield, ROI and Profitability
- Risk Forecasting and Evaluation: Value of a Trade (Bet)
- Preventative Measures: Setting the Starting Bank
Section B: Developing a Betting Strategy
Market Dynamics, Cluster Groups and Betting Tables
Market Dynamics
- Betting Odds are Prices of Bets
- Falling Odds represent Price Increase
- Bookmakers adjust Betting Odds to Public Opinions
Building of Cluster Groups
- What are Cluster Groups?
- Clustering Depending on ‘Strength’ of the Team
Betting Tables: Over/Under ‘X’ Goals
- Goal Distribution by Team
- Team Calculation Tables
- Standard Deviation Tables
- Using Calculation Tables to Determine Betting Odds
Finding Value Bets
- Everything that Glitters is not Gold
- Method I: Value Betting using Cluster Group Tables
- Method II: Value Betting using the Value Calculator
- Cluster Groups, Value Calculator and Bets Identification
…or ask any questions in the comment section below.


Hi Soccerwidow,
Another question, sorry 🙁
On page 72, exercise (D) asks me to ‘Calculate the game between Hannover and Dortmund using the Value Calculator Method and compare its suggested odds with the highest market odds.’
But, again, where do I source the relevant stats for the value calculator then? Thanks for your help last time. I figured out that the accompanying spreadsheet enables me to switch between Bundesliga teams to generate those stats (and then simply go back and substitute the relevant data). But, as far as I can tell, that spreadsheet is only suitable for the last 5 seasons approach. I can’t find the snapshot of the value calculator for these two teams.
Kind regards,
Audiendi
Hi Audiendi,
Sorry for that confusion. You are making me aware that I put too much information into the course and packed it full with knowledge that is very obvious to me but not necessarily for the reader. I will take that into consideration once I start reviewing the course. I’ll have to extend on the explanations!
Regarding your question… Data is always football-data.co.uk; there is no other source of free and reliable data available on the Internet. To help people with the Value Calculator here’s a video: How to prepare data for easy copying and pasting into the Value Calculator.
Hope that helps. 🙂
Hi Soccerwidow,
That’s okay! Actually, (I feel a bit guilty saying this), I’ve watched that video before and have learnt how to use the Value Calculator (although I’m not betting until I finish the course). I’d just forgotten how to use it and I wasn’t sure if the 25 match results were included in the accompanying spreadsheets.
I probably shouldn’t have troubled you over such a trivial thing, given I could have figured out the answer with extra effort. Anyway, slowly but surely we get through the course. I’m nearly at the halfway point.
Kind regards,
Audiendi
Hi Soccerwidow,
I’ve slowly been doing this course. I want to say a big thank you, I think I have learnt a lot.
Just one thing is annoying me no end. On p: 62, you write
‘… we need to calculate and to make it as easy as possible, with the knowledge that calculating everything exactly is virtually impossible and unnecessary, we will therefore use the %CV of the entire Bundesliga to calculate matches of individual teams.
Then, with respect to the correction factor for the Value Calculator, on p:68, you write:
‘… looking at the contribution of the 13 ever-present teams over the five seasons, the illustration [of the distributions of the respective goal differences] became more chaotic.
Therefore, the “regression towards the means” is definitely not the distribution of the whole league.
The “correction factor” is the H2H games!’
I realise that you’re talking about different ways of calculating odds. Nevertheless, it does seem to be a bit of a contradiction to me.
How do you reconcile the notion of studying the standard deviation around the mean (the expected value) for the entire Bundesliga as the best way of determining the range of fair odds with the notion that the entire league’s distribution is too vague and chaotic to be a precise correction factor?
Sorry if I’ve misunderstood something along the way or if I’m simply confusing different concepts. I certainly don’t wish to seem rude. I’m extremely grateful as I’ve learnt HEAPS from this. This particular question just has me SO baffled.
Hope you’re well, Soccerwidow.
Kind regards,
Audiendi
Typo…
[of the distributions of X Goals scored for the respective teams]*
Sorry about that. I did not intentionally misrepresent what you are teaching us.
Hi Audiendi,
The chapter you are currently in, teaches the calculation of ‘Zero’ Odds/ Fair Odds. There are many roads that lead to Rome and the same applies to calculating odds: There are many methods to estimate the possible future result. Therefore, please continue with the course and you will see that many questions that arise at the beginning are explained later when the various puzzle pieces start falling together.
The course teaches two concepts… one using 5 seasons’ data under the assumption that the performances of teams that have been playing for consecutive 5 seasons in the same league don’t change overnight (Cluster Tables) and the Value Calculator, a tool that calculates matches with teams involved that haven’t played for 5 consecutive seasons in the same league, but often enough to have a few H2H results available as correction factor.
Of course, these two tools lead to slightly different results, but as mentioned in the course many times: From a statistical perspective, football matches do not occur frequently enough and the margin of error is therefore always going to be relatively large.
Once you reach chapter 7. (p.116+) you will compare both, Cluster Tables and Value Calculator and see, that both reach similar but different conclusions.
As mentioned in chapter 1.4. (p. 28+) – High (good) trueness of the mean is achievable, but not high precision. Nobody can calculate totally exact, not even the bookmakers…
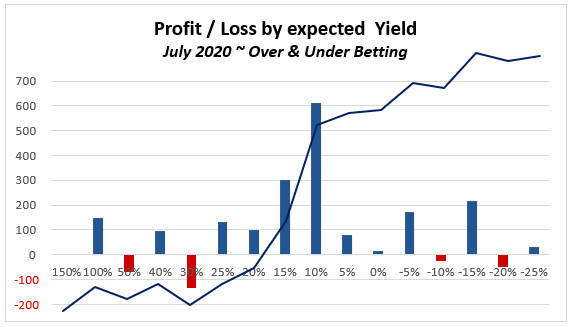
The above graph shows the distribution of Under 2.5 results in comparison with the odds (implied probabilities). Despite the bookmakers pricing their odds close to the true odds the really observed results are still zig-zagging around the implied probabilities of the odds.
I hope this helps to answer your question.
Best wishes,
Soccerwidow
Hi Soccerwidow,
Thanks for the considered and informative response. I guess it will start to make sense further down the track.
Another question, sorry.
On page 71, question B asks me to ‘calculate the odds for the Hannover vs Dortmund game (as in Fig. 27) for all ‘Under/Over X Goals’ bets using the statistics of the last five seasons.
But where am I supposed to source the statistics? Have we gone over those teams already in the course and I’ve simply forgotten?
Sorry to be a pest.
Kind regards,
Audiendi
Hi Audiendi,
To answer that question in the exercise you will have to return to chapter 2.3.3. (p.58+) and redo all the example calculations, but with Hannover & Dortmund (instead of M’gladbach & Hamburg).
You’re not a pest! Don’t worry. Learning is hard, and I certainly prefer learners that ask questions to those who give up too easily. 😉
Hi,
I backtested this strategy for the last seasons of EPL and Bundesliga 1, but both returned -EV, EPL – 90 EURO with 10 euro stakes and Bundesliga -10 euro with 10 stakes.
A total 139 bets were made, where I found value based on the calculated fair odds and the best odds available at the market for that match.
Do you have the results for the last seasons of EPL and Bundesliga 1 ? Am I doing something wrong?
Hi Sarkec,
no, you are not doing anything wrong. The only thing I would suggest is to leave the EPL alone. They don’t play as nicely ‘statistically correct’ as the Germans.
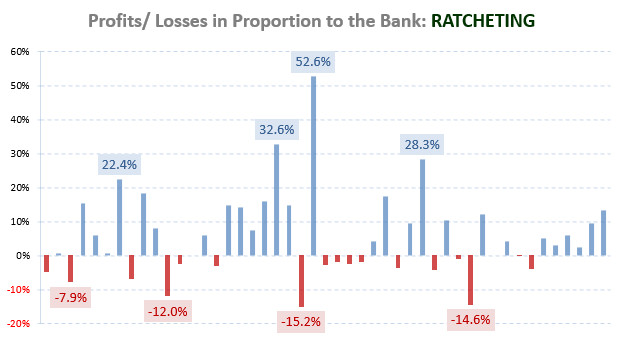
The main problem with betting is that even if you consistently bet with a mathematical advantage on your site, the result distribution is random. That means that everybody will be experiencing different P/L curves if they don’t chose exactly incidentally the same bets.
I’ve had a similar question to yours on another article and as reply I produced a P/L simulation. Just have a look at this: https://www.soccerwidow.com/football-gambling/betting-knowledge/value-betting-academy/simple-steps-win-over-under-betting/#comment-19567
Hello. Thank you for the reply. I imagine that the work that goes into the books and articles is considerable so if it happens, great, if not…that’s life.
I read the article and using auto translate and got the basic facts and seems interesting I will be testing this out over the next couple of weeks on the exchange. If it works (of course not every time but consistently) it could be a great tool for pre-match trading either to get a few free ticks or create free bets, either option seems very interesting.
I hope you find the time to translate the update for the Over/Under course to English. I think that the course is very good and would really like to see more of it.
Good luck with everything.
Hello. I bought the book a couple of months ago, went over it, did all the exercises. First of all I should say that I had some small prior experience with statistics but I knew very little about excel. The book is very interesting and as far as I was concerned it is not a hard read, and English is not my first language. After finishing the book I created a small version of a value calculator just for overs and unders as well as working with cluster tables and started testing.
I soon found out that back-testing would be hard for me because I have very limited access to bookmakers and have to rely on the exchange. That is why I am just writing now, because I needed some time to have at least a reasonable number of matches to form an opinion. My results so far are very interesting. I work with two probability clusters for the value calculator picks as well as using the ratio mentioned in the book for selection purposes.
The first probability cluster is >75, of course if there is value in the bet. As you can imagine the strike rate is high, losing streaks low and bank has shown consistent growth with 150 bets so far. The second cluster is >50<70 probability. Here the results have been less consistent, but still profitable after 117 bets. I should say I am using very very small stakes. It does take time, I am building my own database for results and head-to-head data for every championship that I get involved in. I also keep track of every bet I make including probabilities, final results, true odds, and exchange odds so that I can later try to identify ways to improve the selection process.
Using the clusters I do not have enough to form an opinion yet but the seem really promising. All in all the book is worth the money in my opinion. I look forward to the new book concerning 1 X 2 betting, if you actually have time to finish it.
I had one question. So far I just went for set and forget type of bets so no trading in play. What we calculate are true odds before the game starts. If i wait in-play for the odds on the 1.5 market, for example, to reach a point where they were value at the start of the game, is that bet viable?
Thank you very much for all your materials, I found them all very informative. Good luck with your future content and all the best.
Hi Vlad,
the odds in-play will go up to the expected odds; the problem is that there may be a goal the very first minute and you may not get your match. However, what you may consider, as you are interested in trading, is, to carry out the calculations one week (or at least a few days) before kick-off and then watch the odds moving in the direction of the calculated odds ranges within the last few hours before the match starts.
Sometimes they reach the calculated range before kick-off but quite often they will only move by a few ticks. However, they will still move in the expected direction. Have a look at this.
Coincidentally, I have just written an article on this topic. Unfortunately for Soccerwidow readers, it’s in German: Tipp für Trading: So werden Trades Smarter Simply run an auto translation over it. It should be understandable; I tried to write in as short sentences as possible.
With the 1×2 book English readers will have to wait a little longer. As my mother tongue and education is German, I feel much more comfortable writing in German. Sorry! The Over/Under course is currently undergoing a massive update in German (for example, a large chapter on trading has been added – above article is a part from the update). We’ll see if we get anywhere with crowdfunding to get the book in the book shops and, if the book sells well, then there will be an English translation following.
I truly hope that I will find the time to write the long promised book on 1×2 betting next year!
Hi Elena,
Thanks for clarifying things.
I have to apologize about Bayern – Augsburg. I was looking at the wrong numbers when writing that comment. What I meant was “I got 9 and 15”; 15 Under 2,5 for Augsburg; 1 from the 15/16 season, 11 from 14/15, and I only have 3 more from their last 7 away for the 13/14.
About the course; I found it clear, understandable, concise, and as such easy to follow. I have some arbing experience so I was already familiar with some of the material. Several times while reading through I found myself thinking “Yeah, but if that’s the case what about this or that” – only to have “this or that” fully explained on the very next page (I had a few good laughs at myself about that). It feels very rewarding, gradually expanding on the matter, connecting the dots, and tying it all together beautifully towards the end. In short – didactic method done right.
Still, I have to bother you with two more questions.
In value bet example on page 86 we have zero odds at 1.23, range is 1.18 to 1.29 and market odds are 1.27. There you specify that since the market odds are within the expected range it is not a value bet. You also offer a shortcut to determine if a bet contains value i.e. if Yield (Value II) is lower than RSD (CV) it is not a value bet. Then we have the exercise 7.4 B) where market odds for Hoffenheim vs Werder and Hannover vs Dortmund are also higher then calculated zero odds, also fall within the range, and Value II is also lower than RSD – I calculated Yields of 2.56% and 2.63% respectively, however in solutions you say both are value bets. Only difference I could find is the use of HO/AO quotient to calculate probabilities for the latter.
Finally, and this one bothers me most, I have a concern about Tempobet (or any bookie in the future with similar business model). They constantly offer heavily inflated odds on the favorites e.g. 1.18 on Bayern at home while the next best price is 1.10; or 1.65 on Leverkusen with 1.56 being second best. If we are using these odds as “public opinion correction factor”, and we have 79 bookies showing odds between 1.08 to 1.10 and just this one with 1.18 – it’s obvious what the public opinion is. I wouldn’t feel comfortable using their price for any calculations. Of course, this only becomes an issue when it affects in which cluster group a game falls, but I already saw it happen twice in few matches I checked. Am I wrong to dismiss their odds in such situations, or dismiss Tempobet and any bookies alike altogether?
Hi mrgud,
Thanks for the praising words. I’m very happy that the course provided you with one or another insight and laugh. 🙂
You are on the safer site when you carry out calculations with average odds. Therefore, you can dismiss Tempobet without worrying too much about it. Average odds are far less volatile as highest odds.
Regarding your other question… At the end of the course there are a few suggestions (examples) on how to pick value bets, and I have purposely included a few contradicting examples to make the statement that “many roads lead to Rome”. Unfortunately, there is no right or wrong which applies to every league in this world and to every bettor in each country. A blue pause simply doesn’t exist. Sorry!
Once you have carried out the exercises at the end, then apply all your knowledge gained in the course and experiment (on paper, of course) with other options to pick value. It’s not easy, I know, but I’m sure that you will finally utilise your knowledge about odds calculation and the bookmaker market and work something out that works for you.
Hi there,
I was about to finish the course but I got stuck at the final exercise, from D) – the part where VC gets in the action. I tried both games from D) and one from E) but I couldn’t get the results you show in solutions.
Hertha – Stuttgart. Screenshot shows 18 games Under 6.5 each. There were no 7 7+ games for each side.
Bayern – Augsburg, why even do them when they had only 5 h2h? Also how did you get Bayern 9 and Augsburg 16 Under 2.5 games? I got 11 and 9.
M’gladbach – HSV, Screnshoot you provided shows 8 h2h Under 6.5 – I got 9.
I gave up after the last example. Wasted hours, triple checked the data I’m entering, and I’m off every time. So either I don’t have a clue what I’m doing or there’s something wrong with the answers provided. I enter last 25 league home games for the host and the away for visitors. Last 10 years of h2h competitive encounters where home team was also hosting. And of course, since matches from the book took place in Sep/2015 I entered the data preceding the games in question.
I have a couple more questions about the course – but I’ll hold on to those till you help me figure out this final step.
Hi mrgud,
Sorry for your troubles. I just checked the calculations for the course, and it seems that you have stumbled upon one mistake in the course book.
Hertha – Stuttgart… The calculations which you have carried out are probably right as the VC I filled in for the course only contains 18 matches instead of 25. No idea, how that happened but it did. Sorry, mistakes happen.
Bayern – Augsburg… I normally recommend 6 H2H matches, and you are on the safer site if you stick to this rule. However, for the course I did an exception to get enough exercises as we have only been analysing one single weekend in the Bundesliga.
Bayern – Augsburg… … Please check your Under 2.5 Goals count again…. My goal count is correct, and logically speaking… Germany is one of the leagues with the highest goal count and Bayern contributes to that heavily. No way that Bayern has more Under 2.5 goal games than Augsburg.
M’gladbach – HSV… Your count of 9 H2H matches is probably correct as there is one match on my list I couldn’t find the results for, so, I just simple disregarded it. Here are the 8 H2H matches which are included: 24.09.2014; 30.03.2014; 26.09.2012; 24.02.2012; 17.12.2010; 28.03.2010; 07.03.2009; 13.04.2007
One major thing you probably learned through the course is that it’s all about statistics and strong deviations. Therefore, by not finding one H2H match for M’gladbach – HSV this didn’t freak me out. It was just adding to the uncertainty of the calculations.
However, sorry for the mistake in the Hertha – Stuttgart game. This shouldn’t have happened.
By the way, how did you find the course?
Best wishes,
Elena
Thanks Chris, we are humbled by your kind words!
I’ve added a few links to your text to direct others to the products you mentioned.
Yes, there is a stigma attached to any site that sells gambling related products, but as they are put together by mathematicians here who are unconnected and unemotional regarding the sport in general, success at gambling boils down to a simple numbers game.
And bookmakers exist to take advantage of most people’s poor grasp of mathematics, I’m afraid.
When I see adverts telling people to gamble responsibly and to stop when they are no longer having fun, I cringe to say the least. The reality of the situation is the strong preying on the weak, and the vast majority of people don’t gamble for fun – they gamble to win.
Hopefully, we do help people reassess their own abilities when it comes to understanding gambling maths, and if we can stop them from losing, then that’s our job done.
As you say, most of our guidance is in the form of free information on this site, but if people require the little extra help in the form of ready-made solutions on a plate, then the money they pay us for those products will probably be the best value they will ever receive for such small stakes in their gambling careers.
All the best.
I thought I would take the trouble to write and tell you that I love what you have achieved with Soccer Widow! I’ve seen a lot of so called experts selling products and services relating to gambling, but none of them have come close to SW’s offerings for me.
I started with the Over/Under Odds Calculation Course and whilst it took me some time to get used to a “new” way of looking at markets because of some bad (unprofitable!) habits I had to reverse, I’m now on course to becoming profitable in my betting and considering plans to increase my existing tiny stakes (I’m naturally risk averse…) as a result of the positives I’m seeing coming from the mindset change.
The Value Bet Detectors and HDAFU Tables are really challenging my perceptions of what the numbers mean and how to maximise their potential returns.
Without the SW products and education, both paid for and all the free info shared in the blog, etc, none of this would be possible.
In return, I’d like to say well done on a cracking product portfolio and thanks for helping me to find the light! I’m so looking forward to the new football season in August, my real life trials of the solutions you have provided so far have been very interesting and this year will see the Summer leagues I’m trialling between now and then be the first season results that are profitable for me.
I can’t wait to see what you release next – I’m sure I will be buying it, whatever it is!
Thanks again!
I am a beginner and I don’ t know the meaning of back and lay. Can I buy this ebook?
Hi ivan,
the course explains not only the difference between back and lay, but also the opening odds range, you learn to calculate your own betting odds, and much more!
Hi Soccerwidow,
thank you, now it works fine:).
It’s really strange. I even tried Data@SW2015 on untouched copies of 2010-15 file and it doesn’t work, while Data@SW2016 for the 2011-16 file works fine.
Hi jo,
I just reactivated your purchase. Please re-download the file and see if it works now.
There was a bug with the passwords and we updated the Excel file in October what was after your purchase. So it should now work fine. At least I hope so. 🙂
Sorry for any troubles,
Soccerwidow
Hi Soccerwidow,
in Germany 2010-2015 Over/Under workbook provided password for GD by Team tab is GbT@SW2015. In fact, the real password is GDbT@SW2015. And it’s the same for 2011-2016 Germany Over/Under wb – provided password misses “D”. For Data tab password Data@SW2015 doesn’t work in 2010-2015 wb, but works fine in 2011-2016. I tried some other options, but this time I’m not able to crack it. What is the password for 2010-2015 O/U workbook Data tab?
Hi jo,
Thanks for making us aware that we provided the wrong password for the GD by Team tab.
However, Data@SW2015 works fine for me for the 2010-15 file and Data@SW2016 for the 2011-16 file.
Hello!
Did you try this method of calculation of goals before producing it?
If yes, what results did you have?
I understand the concepts presented in it, but I am very sceptic about getting good results from my value bets.
Do you think someone can succeed long term with this method?
Thanks
Hi sarkec, it’s a while ago that we did public match previews, but here is our record: Soccerwidow’s Value Betting Results: 274 Bets, from 07/12/2011 to 30/06/2012
My husband has been nagging on me for years to reveal to the public my method how I did the picks, and this how the course came to live.
So, yes, you will get good results by using statistics!
Good luck,
Soccerwidow
Your course has proven to be invaluable. It teached me how to approach to statistical analysis to ensure the understanding of every odd that the bookies price. I am also developing a strategy based on what i learned on the book, and i have been able to create my own analysis tables for every league i am interested in. I am currently running a simulation on betting o
I am currently running a simulation based on finding values, and i have a solid idea on how to support what i have learned in the course with the help of inflection points and odds clusters regarding betting on 1×2. So i want to ask, if i buy the HDA simulation tables am i able to see excel formulas behind the calculations, like in the tables that came with the course? That helped me so much with understanding how to fine tuning this powerful betting tools to my needings! (And my excel competence, too)
Hi Daniele,
I’m very happy to hear that you are finding the course so helpful, and of course you will be able to see the Excel formulas behind the calculations in the HDA tables. However, please be aware that these are two totally different products. The O/U course teaches odds calculation whilst the HDA tables are simulations “what would have happened when”. There is a course scheduled for next year which goes in depth with 1×2 betting and utilising the HDA tables.