4. Market Viability
Admittedly, HT betting is less popular than the FT market – just look at betting exchange liquidity. Also, check out any odds comparison site and you will see not all bookmakers in the FT market offer odds on HT results.
Due to lack of demand, turnover on the HT market is slower in accumulating and inflated underdog prices in particular need to be held for longer periods to offset money riding on the favourites, as the bookies attempt to balance the books by manipulating their odds back and forth.
It is also worth remembering that HT bets produce quicker bet resolutions than FT bets. Faster cash flow means greater numbers of betting opportunities and higher bank turnover, both of which are essential components of any successful football betting system.
5. Predictability
On paper, HT statistics look less volatile than their FT counterparts.
By ‘less volatile’, we mean HT market analyses are driven by fewer clusters of more concentrated data.
FT match results tend to produce a wider scatter of statistics in most events where there is an HT equivalent; in other words, more clusters of different outcomes, each containing lower relative concentrations of data (i.e. more volatile).
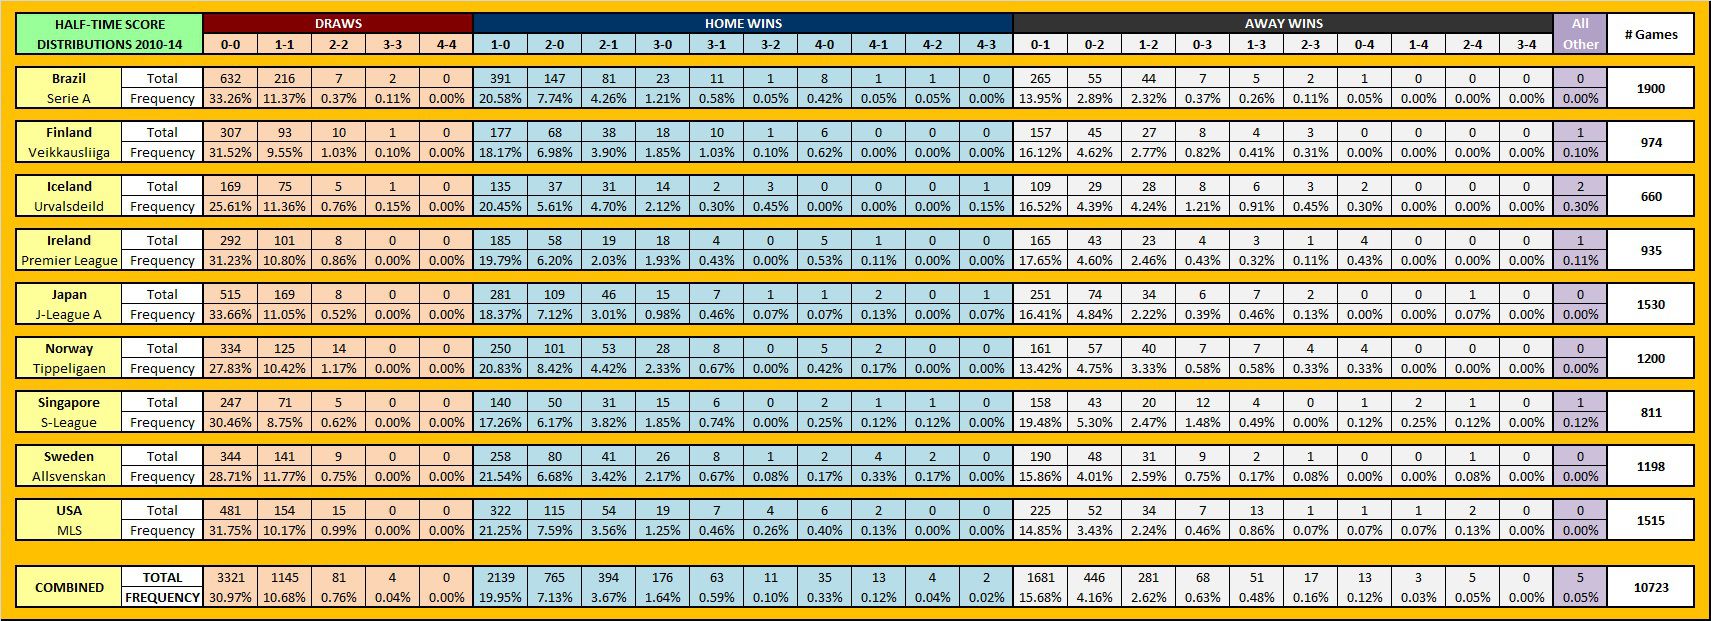
To illustrate what we mean, here are two screenshots showing the HT and FT score distributions from nine different leagues (where the seasons start and finish in the same calendar year) over five complete seasons (2010-2014), encompassing a total of 10,723 matches (a significant data set).
Click on the images below to open each in a new tab – use the magnifier provided to enlarge them further:

As you can see, just four HT scores (0-0, 1-0, 0-1, 1-1) are responsible for 77.27% of all HT scores (a total of 8,286 matches), and all four scores each claim more than a 10% share of the total. The 0-0 draw is by far the most frequently occurring HT score with a 30.97% share of the whole (3,321 matches).
The FT distribution is far more fragmented. The four most populated scores (1-1, 1-0, 2-1, 2-0) account for just 39.02% of all FT scores (4,184 matches), and only the 1-1 draw and 1-0 home win exceed 10% each. The 1-1 draw is the most frequently occurring event claiming 12.03% (1,290 matches).
Note: two of the four most frequent HT scores are draws, whilst three of the four most frequent FT scores are home wins, mirroring the pattern of most frequent 1×2 results.
Summary
The fundamental characteristics of the game of football existent to some degree or another in every match definitely contribute to the differences between HT and FT stats.
Any experienced follower of the game will tell you that the first and second halves of matches are usually played out under very different conditions.
There are general differences between first and second half team tactics, managerial attitudes towards the unfolding drama, the players’ physical capabilities, and so on…
Of course, from the moment the first half finishes, FT statistics continue to build for another 45+ minutes’ game time, which makes such visible distinctions between the HT and FT data sets inevitable.
We have seen how HT betting is more predictable than FT betting, but the latter still remains more popular with punters and bookmakers alike.
Why should this be?
With most of their customers already conditioned to gamble on a much more volatile product, do you really think that bookies are straining at the leash to promote HT betting in the same fashion as the FT market?
No, nor do we.
Ironically, the finger of blame points mostly at punters’ lack of education/knowledge for creating this situation.
This exploitation of public perception by the bookmakers is only one sign of a common pattern. The bookies also deceive their customers by twisting odds to suit the public opinion of individual events.
Take a leaf out of our book and look at the HT football betting market once in a while!


Hello! It’s nice article
What strategy can i use to predict half time odds?
Nice writeup. I am deeply involved in betting for Under 1.5 HT and Under 2.5 FT. is there a better system or method of predicting such games in different leagues? A quick response is hereby needed, please.
Thanks.
I am from Nigeria how can I obtain the current 12X system for English weekend fulltime football pools fixed odds coupon 2017/18 season
Thanks
Hello Victor,
If you are looking to analyse individual games, then perhaps the Value & Probability Calculator is something to consider.
If it is a system you wish to follow, then the HDAFU Tables are the product to go for.
Good luck and thanks for your question!
Is there an easier way to use oddsportal to gather historical data for markets other than 1×2?
With 1×2 I can copy and paste the full page and then tidy up in excel with text to columns etc but for other markets you have to spend time going into every single match?
JM,
Yes, you are exactly right with the 1×2 market in Oddsportal – Copy and paste each page and then tidy-up in Excel. Each season takes about 12-15 minutes to prepare in this manner.
Any bet type other than full-time 1×2 is unfortunately a manual job where odds have to be scraped individually.
Apart from football-data.co.uk (free) and football-bet-data.com (subscription), I am unaware of any other service providing historical odds.
Betexplorer.com is owned by the same group as Oddsportal, so the fare on both sites should be identical.
The big problem with all of these services is that their respective API’s responsible for collecting the data are unreliable.
Some bookmakers’ odds never get updated from their original opening price, whilst others keep updating long after the match has kicked off.
Of course, this distorts the real picture.
Oddsportal odds must therefore be checked to iron out these anomalies. The easiest way of doing this is to set-up overround calculations to spot the sets of odds which are obviously out of sync.
Getting reliable odds data is the most time-consuming part of our analyses.
Thanks for your question and I hope the answer is of assistance.
Hello Marius,
Thanks for your question.
The best site for historical results and stats is http://www.oddsportal.com – this is where you will find what you are looking for. They have a huge database of archived odds and results.
Otherwise, check out our article on FT and HT simulation tables – both types of table contain all the historical odds and results from the last five complete seasons in each league available.
Enjoy your weekend too!
Hello,
i like this article and understand the process. But where can I find the historical half-time odds and results? Is there a website where i can find them?
Have a nice sunday!