
Almost exactly a year ago Soccerwidow published the article Home–Draw–Away: HDA Systematic Betting and provided the following betting tips for the 2011-2012 English Premier League season:
- Back Fulham at home
- Back the Draw: Fulham away
- Back Manchester City at home
- Back Manchester United at home
- Back the Draw: Aston Villa at home
If you followed these tips (and some people did: see comments section at the bottom of last year’s article) then you achieved a yield of between 20-30%, depending upon the type of staking plan used and the value of the obtained odds.
Here’s a summary table of the individual results (selection clashes and how they were dealt with are explained in more detail in the free spreadsheet available to download further down this page):

There were 5 recommended bets for 2011-12. The initial starting bank was calculated at 10 units x 5 bets = 50 units.
Employing a fixed win/fixed risk staking plan of 10 units per bet the initial bank was recycled 12.6 times (632.35 divided by 50). (Read also here why we consider this type of staking plan to be the most efficient).
So, the profit from this little venture amounted to 172.84 units, almost 3.5 times the initial bank. The yield achieved was 27.3% (profit divided by total stakes).
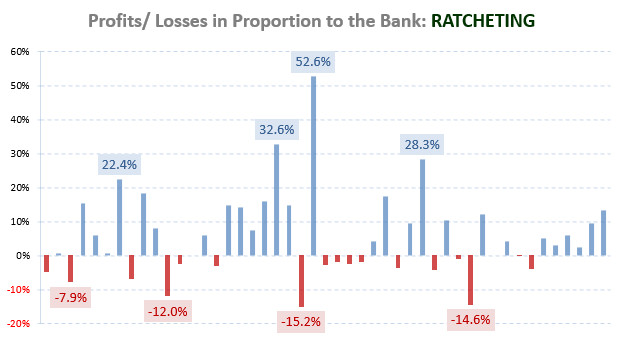
The graph below shows the development of the bank over the season:

(Excel .XLS Spreadsheet 158 KB)
In return for this freebie we would appreciate if you could share this article via your social network or give us a ‘thumbs-up’ with a ‘love’ or ‘like’ via Twitter or Facebook 🙂
Easy Money?
Naturally, professional betting is never as “easy” as it may seem at first glance. Indeed, in order to achieve this level of profit, 92 bet transactions were required together with relevant monitoring sheet entries.
Taking a generous estimate of 15 minutes per bet (finding best odds, log-in to relevant bookmaker account, find the match, calculate the stake, enter figures into a monitoring spreadsheet) the total time taken for these transactions would have been 23 hours.
On the basis of 10 units fixed win/fixed risk per bet a profit of 172.84 units was made translating into an hourly rate of 7.51 units. As our calculations are all based around a standard 10 units, you can factor the figures by any amount to calculate different profit/hourly rates for any stake of your choice.
For example, instead of 10 units = £10, use a factor of 5 to increase to 10 units = £50. The initial starting bank required would then have been £250 (5 bets x 10 units x factor 5), and the profit after one year of systematic betting would have added up to £864.20 (£172.84 x 5), equating to an hourly rate of £37.57 (7.51 units x 5).
However, these calculations of course only apply when the betting is approached without emotions and in an entirely professional manner.
Take a more enthusiastic approach and you could find yourself reading team news for every match, watching some of the games, experimenting with in-play betting, or procrastinating in other ways. It is easy to imagine spending an average of two to three hours either directly or indirectly involved on each bet. With our sample of 92 bets, this quickly adds-up to between 184 and 276 hours, thereby reducing the effectiveness of the system and its profits respectively to just 0.63 and 0.94 units per hour.
In arriving at the system, our calculations are based on the average odds in the bookmaker market which are then increased by a flat 10% rate to reflect the higher market odds usually available in the betting exchanges.


Hi, you used in average 13,73% of your bank, if I’m not wrong. With all my respect, no serious bettor uses stakes of more than 5% of his bank. So “the initial bank was recycled 12.6 times” is totally exaggerated. However 27% yield seems to be very good, even though there were only 92 matches.