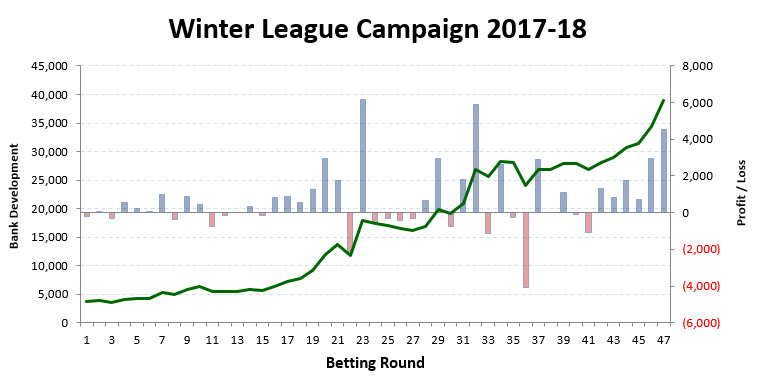
The 2017-18 Winter League Campaign consisted of 138 betting days spanning 10 and-a-half months.
Despite a rocky start and other challenging periods throughout 2017-18, a starting bank of 4,000 units was eventually turned into 38,925.
Image 1: Winter League Campaign Development Graph(Bank Development ↔ green profit curve; Profit/Loss ↔ weekly columns)
Portfolio Chosen
Regarding the selection of systems we will expand a little on our decision-making process in the league-by-league review below. For compiling this portfolio we used our HDAFU Tables.
How the systems were originally chosen, you’ll find a detailed explanation using the EPL pick as example here: Finding a System Using the HO/AO Quotient
To read about the compilation of the portfolio used for this article here’s a link to our analytical article: Judging the Risk of a Football Betting Portfolio.
There you will find explanations on how to calculate the overall probability/expected hit rate of a portfolio and how to judge the risk. You will also learn how to predict winning and losing streaks, and what kind of profit/loss curve to expect when compiling your own portfolio of bets.
Let’s now dive in to the performance report without further ado.
We start with a league-by-league review and then see how they all put together reduced the risk and finally produced a result as expected.
2017-18 League-by-League Review
In Image 2 below you can see that hardly any individual system (league) within the portfolio met its expectations (predictions), yet the overall performance of the portfolio fully met the expectations, profit-wise, yield-wise and hit rate-wise.
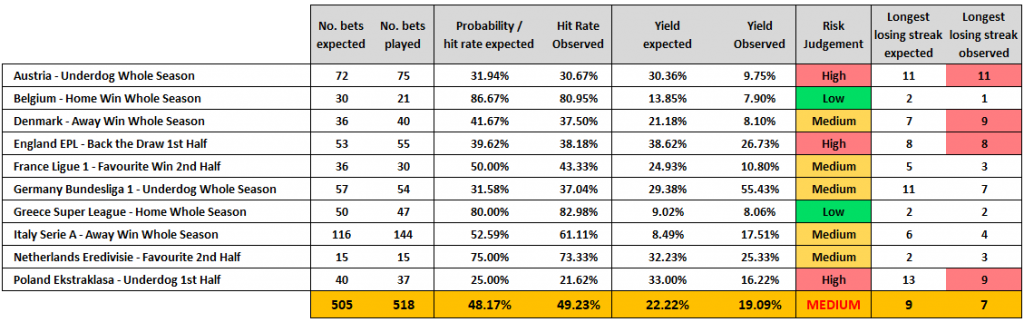 Image 2: Final performance of the 2017-18 winter league portfolio
(1) Austria Bundesliga – Underdog – Whole of Season
Hit rate expected: 31.94% (associated risk: high)
Yield expected: 30.36% (associated risk: high)
Despite its low hit rate this system was included because a healthy yield was expected. When judging a system fit for inclusion, healthy yield indicates that a profit can still be made even if something goes wrong, e.g. the hit rate is a little lower than expected.
Hit rate achieved: 30.67% (just below expectation)
Yield achieved: 9.75% (far below expectation)
The hit rate was more or less achieved, but the profit was 65% below budget. Perhaps the odds that were obtained were too low or there were just not enough larger priced winners in this cluster.
(2) Belgium Jupiler League – Home Win – Whole of Season
Hit rate expected: 86.67% (associated risk: low)
Yield expected: 13.85% (associated risk: low)
Included because of the high hit rate indication to add reliability and stability to the portfolio, despite a low yield expectation.
Hit rate achieved: 80.95% (below expectation)
Yield achieved: 7.90% (below expectation)
The hit rate was below expectation and hence the yield too. However, a profit is a profit albeit small here, but no complaints. In the end, Belgium produced a profit and helped the portfolio to remain balanced over the season.
(3) Denmark Superligaen – Away Win – Whole of Season
Hit rate expected: 41.67% (associated risk: medium)
Yield expected: 21.18% (associated risk: medium)
Another judgement call asking the anticipated yield of around 20% to buffer the expected hit rate and still turn a profit.
Hit rate achieved: 37.5% (below expectation)
Yield achieved: 8.1% (far below expectation)
The hit rate was below expectation and hence the yield too. But still a profit from a medium risk venture.
(4) England Premier League – Draw – 1st Half of Season
Hit rate expected: 39.62% (associated risk: medium)
Yield expected: 38.62% (associated risk: high)
Despite its low hit rate this system was included because a healthy yield was expected. It was felt that the risk was worth the potential reward.
Hit rate achieved: 38.18% (just slightly under expectation)
Yield achieved: 26.73% (good, although far below expectation)
The EPL is probably the most analysed league in the world and it is difficult to spot long-term value for betting systems that are reliable and come out to expectations. The hit rate was in line with expectations but the yield was not. Nevertheless, a healthy profit was achieved.
(5) France Ligue 1 – Favourite – 2nd Half of Season
Hit rate expected: 50.00% (associated risk: medium)
Yield expected: 24.93% (associated risk: medium)
The yield looked slightly too high for an expected hit rate of 50%. This may have been an arbitrary positive result observed in the inflection point graphs, especially as the expected number of bets was only 36. Nevertheless, this system was included in the portfolio because of the risk-reward balance.
Hit rate achieved: 43.33% (below expectation)
Yield achieved: 10.8% (far below expectation)
Only 30 bets were played (from expected 36) and both hit rate and yield were much lower than expected.
(6) Germany Bundesliga – Underdog – Whole of Season
Hit rate expected: 31.58% (associated risk: high)
Yield expected: 29.83% (associated risk: medium)
Normally, systems with an expected hit rate of under 35% (classified as ‘high’ risk) and with an expected yield between 15% and 30% (‘medium’ risk) get an overall risk judgement: HIGH RISK.
Although the combined expectations of hit rate and yield here would have labelled this system as ‘high risk’ we downgraded the overall risk judgement to ‘medium risk’ as it was Germany and the Bundesliga is probably the statistically most reliable league we are aware of.
Hit rate achieved: 37.04% (above expectation)
Yield achieved: 55.43% (far above expectation)
German underdogs (not sausage dogs) were a (woman’s) best friend, and proved to be the most successful of all our systems.
If the EPL is just about the most ‘statistically unreliable’ league, then the Bundesliga is at the other end of the scale. There is something typically German about the Bundesliga’s constant conformity to statistics, season in, season out – very correct and very efficient.
(7) Greece Super League – Home Win – Whole of Season
Hit rate expected: 80.00% (associated risk: low)
Yield expected: 9.02% (associated risk: low)
The Greek system was chosen for risk diversification in our portfolio. Despite associated lower yields, bets with a high probability of winning break up losing streaks in the portfolio and add stability.
Hit rate achieved: 82.98% (slightly above expectation)
Yield achieved: 8.06% (below expectation)
Not a huge profit but a profit nonetheless. Low priced home wins are naturally odds-on favourites also. Better prices can be achieved on these by placing bets further back in time before the event.
(8) Italy Serie A – Away Win – Whole of Season
Hit rate expected: 52.59% (associated risk: medium)
Yield expected: 8.49% (associated risk: low)
Like Greece, this one was chosen for risk diversification combining a relatively low yield with a probability over 50%.
Hit rate achieved: 61.11% (above expectation)
Yield achieved: 17.51% (far above expectation)
Italy was our second best performer with its mixture of odds-on and odds-against away teams. However, almost all of these were the favourites and just a 15% swing in hit rate (not unnatural with favourites), was enough to double the yield harvest.
(9) Netherlands Eredivisie – Favourite – 2nd Half of Season
Hit rate expected: 75.00% (associated risk: low)
Yield expected: 32.23% (associated risk: high)
The yield here stuck out as being too high for a system with such a high probability. This may have therefore been an arbitrary positive result observed in the inflection point graphs, especially as the expected number of bets was as few as 15. Nevertheless, this system was included in the portfolio and judged as medium risk.
Hit rate achieved: 73.33% (slightly below expectation)
Yield achieved: 25.33% (below expectation)
A very tiny system with only 15 bets expected and indeed, 15 bets played in the end. However, not 12 wins as ‘expected’ but only 11. With margins so tight it was no wonder that the yield figure dropped. Otherwise, despite initial indecision whether to include this system, a profit was made.
(10) Poland Ekstraklasa – Underdog – 1st Half of Season
Hit rate expected: 25.00% (associated risk: high)
Yield expected: 33.00% (associated risk: high)
With such low probability on the table, unreliability was expected, but the reward (yield) was worth pursuing. Furthermore, only 40 bets were expected. This system therefore had all the hallmarks of ‘high risk’.
Hit rate achieved: 21.62% (slightly below expectation)
Yield achieved: 16.22% (far below expectation)
Betting on underdogs is notoriously volatile and it was lucky that the very last two bets of the season both won to avoid a deficit here. 40 bets were expected, but only 37 played that fitted the selection criteria. 10 wins were expected but only 8 materialised.
This was the only system in the portfolio with such a low hit rate expectation in connection with very few bets expected. It was always going to be a shaky, unreliable ride, and it didin’t disappoint.
Was there a single system within the portfolio that performed as expected?
There was not a single system that performed as expected within the portfolio. Of the 10 chosen systems illustrated here, eight underperformed, and only Italy and Germany overperformed (both ‘medium’ risk systems).
The expected hit rate for Germany was 31.58% and it achieved 37.04%
The expected hit rate for Italy was 52.59% and it achieved 61.11%
Although some of the other eight systems succeeded to surpass their expected hit rates, the profit at the end was less than expected. This indicates that perhaps the odds played across the board were a little below those used in the HDAFU simulation tables.
Please remember! Concentrate only on individual leagues whilst compiling your portfolio. Once you start placing bets shift your focus to the overall portfolio performance and bank management. Only after a set period of time, review the individual systems in your portfolio. There will be an article on that topic coming soon…
After you have compiled your portfolio with due care you need to trust your own judgements and follow through fully with your betting endeavour as planned!
Get the Full Report & Check our Statements
The information contained in the spreadsheet is invaluable and we are sure that you will feel the nominal £5.00 GBP charge is a real bargain: It is an ideal template for your own portfolio structuring and monitoring processes, and in addition it provides the opening and closing odds for the 518 bets included in the portfolio.
The size of this .XLSX Excel file is 568KB:
>>> 2017-18 winter league campaign <<<
Spreadsheet Features:
- The spreadsheet details every bet in every system used.
- Includes tabs for the overview of the portfolio, match data of the 10 systems used, as well as their opening and closing odds, and finally the odds used and the staking plan.
- The most important feature is the Ratchet staking tab, which will provide you with the ideas and tools to manage your betting bank professionally.
Final Performance 2017-18 Winter League Portfolio
On the whole, the portfolio performed as expected:
- A hit rate of 48.32% was expected; 45.37% was achieved
- A profit (flat stakes of 100 units) of 11,253.60 was expected; 9,909.00 was achieved (if using 100 unit flat stakes during the whole campaign)
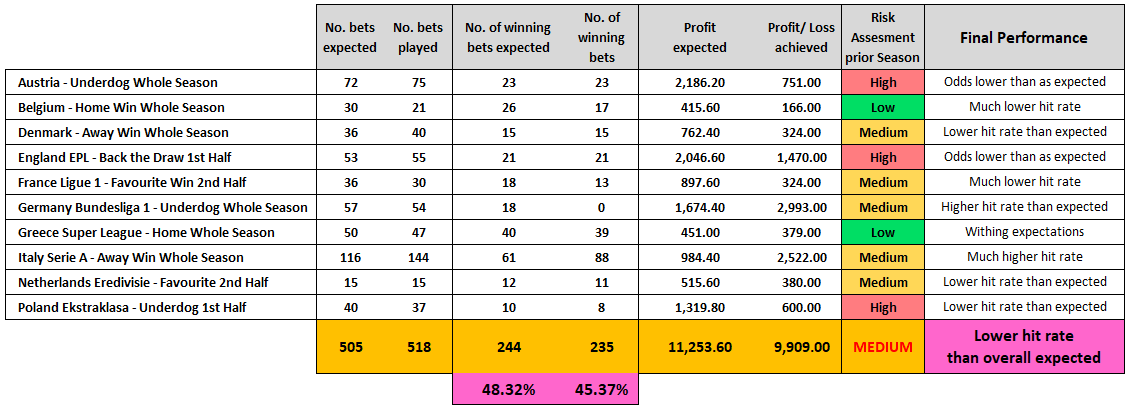 Image 3: 2018-18 Winter League Campaign Portfolio Results
You might say that the portfolio underachieved. But this is betting! The only goal is to finish with a profit! Any achieved profit may be below expectations or above, but as long as there is a profit, the portfolio must be considered as having been successful!
Therefore, remember to look at the performance of the whole portfolio for judging if it was successful. Do not concentrate on the performance of individual systems; not even after the season has finished. Potentially fatal if your mindset is affected by worries about individual systems, especially whilst your campaign is in-play.
However, there are exceptions to this rule and I will write about this in another article and explain when a system can be abandoned in-play, or when a new system can (or should) be added during the season.
35k in 138 Days?
You certainly noticed that in the above chapter we wrote that the portfolio achieved a profit of 9,909 but stated in the title of this article “35k in 138 Days”.
To predict the most likely performance of a portfolio you only can simulate a profit/loss using flat stakes. The same applies to judging the performance of a portfolio. You can only use flat stakes to appraise the effectiveness of a portfolio.
It doesn’t matter what staking plan has been used; in order to evaluate (and compare with predictions) the performance of a portfolio, you will need to see what would have happened when using flat stakes. Otherwise you will be comparing apples with pears.
The sequence of winning and losing bets is pretty random and any staking plan applied would therefore skew the review process. Therefore remember always to use flat stakes for retrospective analysis.
However, the portfolio used to illustrate this article produced a final profit of 34,925 units using ratcheting (= gradual increase of stakes when winning). More details you’ll find in the article: Winter Leagues 2017-18: Bank Management, Staking and Timing >> This article will be published within the next few days.
A Portfolio Reduces the Risk
If you have read the article about judging the risk of a portfolio you may remember the following statement about diversification:
The rationale behind this technique contends that a portfolio constructed of different kinds of bets will, on average, pose a lower risk than any individual bet (system) found within the portfolio.
Diversification strives to smooth out unsystematic or anomalous risk events (outcome of matches/leagues) in a portfolio so that the positive performance of some bets (winnings) neutralizes the negative performance of others (losers).
Have another look at Image 2 for the losing streak sequences.
The expected individual longest losing streaks within the leagues (systems) were as long as 11 bets in a row.
All three ‘high risk’ systems produced, as expected, very long losing streaks: Austria, EPL, Poland.
Denmark produced an even longer losing streak than expected. It started on the 26/8/2017 and continued until 29/10/17 – more than 9 rounds of games! Nevertheless, they recovered to finish with a positive return, although far lower than expected.
However, the portfolio as a whole only experienced a losing streak of seven bets in a row (chronologically).
But try and look at the portfolio as a whole and consider one round (week) as one ‘single bet’. This perspective reveals a longest streak of four (out of 47 rounds) – just about bearable!
Please remember that in order to judge the success of any betting portfolio it is necessary to evaluate the performance of all of its systems together as one, not just individual group members (i.e. bets in just one league or system).
I hope you enjoyed this article and learned how to judge the performance of a portfolio. However, if you are still not clear, then please feel free to ask any questions via the comment section below.


Hi everyone,
Hope you are all well.
I haven’t as yet jumped into the HDAFU tables this season. Life reasons relegated football to the sidelines for a while. How are you all getting on with them this season so far – both summer and winter leagues.
Thanks in advance.
Simon.
Hi Simon, Rado, Jo and also Hi to Rob! 🙂
I know this reply finds you late now that the season is over and now that you made (very likely) a loss which my own compiled tables show me. However, to Robs and Elena’s defence, I can confirm that my simulations using data from football-data.co.uk show exactly the same devastating season 2018/2019 and I guess we all more or less pick the same systems for the winter leagues (Home Wins for Germany etc.). I also wanna add that I’ve compiled my tables using MaxOdds, Pinnacle Odds and Pinnacle Kickoff Odds. So I can see the outcome when using a system for those three different odds. Obviously the losses were the lowest using max odds but still, all three produced a loss on my simulations for many of the most popular winter leagues 2018/2019. Now, what can you do next season?
My suggestion is: calculate the maximum bank (aka highest profits achieved DURING a season) for the past 5 or six seasons. Then calculate the mean of those five values or the lowest of those five. Now when you place your bets stop placing when you’ve achieved the mean of the lowest point. I know that you need to have some discipline to do so but at least stopping at the lowest of the 5 values should always (!) generate a profit in those leagues – at least if you were theoretically able to get the highest odds.
@Rob: now this is an interesting point isn’t it? When should one stop betting? When the maximum bank of all past 5 seasons has been reached? When the mean has been reached? When the lowest point has been reached? This should be interesting and worth another article what do you think? Also in another comment, you mentioned that you wanted to write an article about your opinion on why this season has been so devastating! Will you still do it? 🙂 greetings from Germany,
Florian
Hi Florian,
thanks for your comment. I’m not sure if I understand your suggestion 100%, but based on the way I understand it the mean of the lowest point would’ve been 328 units profit. Not worth the risk and time. Too risky overall since the portfolios showed potential of going down in a very steep curves without any chance of recovery. Your result is another confirmation where this endeavour will almost certainly lead anyone’s bank to in the long run. I decided not to even paper test 2018-19 season tables I bought. I’m sure there will be no better news.
I still have no report from Soccerwidow about my 2018 Summer portfolio I e-mailed to her. But she honestly told me that there was nothing too wrong with it and it was pretty sound compared to Rado’s and Simon’s portfolios. Yet it failed very badly. She also said that other players also lost money…
Hi Soccerwidow, I read all the bad experiences of some users and I’m asking myself if I have to stop betting now..
I started on the 1st December and more or less I have the same bank of when I started.. What do you advise me to do?
Hi Mauro,
reduce your stakes to a size that you are comfortable when losing.
The problem is that portfolio betting is a real art form and if portfolios are not constructed soundly, then there is a high risk that they don’t win. It’s the same with every portfolio, such as shares, etc., not only betting.
Therefore my advice is that until you have compiled a sound portfolio to reduce your stake sizes considerably (to ‘pocket money’ sizes) or even play your portfolio on paper only.
Thanks for your answer Soccerwidow. Well, I think my portfolio is mathematically sound since I made it following your instructions step by step. In fact after 5 or 6 rounds of betting I have now a little more than my initial bank and it looks like it’s going as you described in your articles: the expected hit rate is being respected, the longest losing streaks as well and of course also the ups and downs…. but only 1 month has passed since I started so it’s too soon to see a long term profit.
So my question is: can a mathematically sound portfolio fail in the long run? If yes, has it ever happened to you?
Hi Mauro,
if it’s your first season in HDAFU betting, you should listen to Soccerwidow’s advice. I had my first HDAFU season successful and I think you already know what happened next. Success made me absolutely sure I know how to use the tables to make money, but… in fact, I didn’t. So, take Soccerwidow’s advice and keep doing it for at least 1 season for both summer and winter leagues. You will be better protected from big losses, I think you are far less likely to be lucky and win 2 seasons in a row compared to just one when not knowing what you are really doing. I was carried away by my 1st (summer) season success and I payed a big price for it. And better run your tests on paper only.
I’m not sure yet since Soccerwidow didn’t send me an email about her findings about my 2018 summer portfolio yet. And there should be an article about our 3 portfolios as she said.
But you probably noticed that Right Winger and Soccerwidow judge the risk of a system differently, what is low risk for Right Winger, may be a high risk system for Soccerwidow. My 2017 summer, 2017-18 winter and 2018 summer were based on Right Winger’s risk perception. I will run 2018-19 winter simulations once I’m in the mood to do it and understood my mistakes from her report based on Soccerwidow’s risk perception to see if it will work then.
Based on my current experience, there are some things I would suggest not to do. If system has a losing streak of 8 bets in a row recurring 2, 3 times, they can easily add up into one long losing streak, especially if a system is high risk. I had a system with a losing streak of 8 bets, recurring 3 times in analysis, that turned into 19 lost bets in a row. Stay away from systems that have 20-25 bets a season\half season and longest historical losing streak close to that number. Or even worse, exceeding it. You risk losing every single bet.
Over those 3 seasons, I had zero odds lower than odds range in about 80% of my systems. Regarding systems with zero odds higher than first inflection point, some of them still won, some lost. But the majority of them were high-risk systems according to Soccerwidow’s risk perception. Maybe that led me to long-term failures, but I have to run my 2018-19 winter simulations first to make any conclusions. Since it’s your first time and you do it with real money, I consider your endeavour as high risk. If you still decide to continue with real money, my suggestion is no more than with 20 units. Don’t hurry.
“The absolute main rule in betting is that you must never play any bets below the Zero odds (only very rarely odds below Zero odds may contain value but never when playing a system). You find these odds displayed in the ‘System Picker’ tab.”
Based on that quote how come your 2017-18 campaign report shows that you were betting on odds that were below zero odds, actually around 20% of total bets were placed like that.
That makes me unsure if its fine to bet every game in chosen system and just try to be close to average odds at the end or if we should skip some bets but then the result of the system might be different than HDAFU tables suggest. Also your 2017-18 campaign results would be different if all those bets would be skipped.
Hi Gasper, of course, yes, the results would have changed…
Playing Zero odds plus higher; no bets below Zero odds: The end result would have been 31,943 (489 bets played instead of 518)
Playing Zero odds plus 115% at least: The end result would have been 23,017 (431 bets played instead of 518)
The campaign report you can download provides you with every single match that qualified the criteria set in the portfolio (including the matches below Zero odds) in order that you can carry out your own calculations saving you from the job to go through thousands of games to find data.
Please note that articles, as well as calculations on Soccerwidow, are always for illustration purposes only to make a point. Our goal is to teach you guys to approach betting in a more professional manner and provide you with tools that help you to find an edge. We have to challenge your thinking to achieve that goal. 🙂
Hi Soccerwidow,
I’m a bit confused by this “Playing Zero odds plus higher; no bets below Zero odds: The end result would have been 31,943 (489 bets played instead of 518)”
How come you only found 29 matches that were below zero odds?
If I compare “zero odds” versus “odds available when placing bets” under system performance tab – Italy: Away Win Whole Season already had more then 60 bets where available odds were under zero odds.
Second question is if we look at the results that we get from HDAFU tables, they include all the bets from last 5 seasons (bets below zero odds included) , so if we use a system but we then only bet above zero odds of that system, would we have to actually make a second calculation to see what the results would be then in those 5 seasons betting only >zero odds bets.
Hi Gasper,
sorry, my mistake (typing error in the Excel spreadsheet and calculating therefore incorrectly):
Playing Zero odds plus higher; no bets below Zero odds: The end result would have been 24,347 (405 bets played instead of 518)
Playing Zero odds plus 115% at least: The end result would have been 17,975 (347 bets played instead of 518)
To your second question… It depends which HO/AO quotients/odds clusters you look at. The example you chose was Italy – betting on the favourites to win; these are high probabilities, therefore below Zero odds can be played. The example I looked at was the EPL – betting on the draw – low probabilities, zero odds far below the average odds.
Most of the systems in any HDAFU portfolio are going to be low probability clusters. Therefore, the rule of thumb is, not to play below zero odds.
By the way, a ‘rule of thumb’ is a broadly accurate guide or principle. It is a method of judging that is not exact but is based on experience. A ‘rule of thumb’ is not set in stone!
Hi Soccerwidow,
I could not reply directly to your 9 December 2018 at 7:23 am comment, so I will reply with a new post. You said:
“What I need to see is:-
League; HO/AO Cluster or odds cluster; expected hit rate; expected odds; expected number of bets; observed hit rate; observed odds; the observed number of bets – so far”
Can you clarify what is “expected odds” and “observed odds”? Because I’m not sure.
Hi Jo,
the ‘expected odds’ are the average odds that are shown in the ‘System Picker’ tab (and you can certainly add the ‘Zero odds’ that are also shown there). The ‘observed odds’ is the harmonic mean of the actual bets you have placed this year.
Rado and Simon have already sent me their monitoring spreadsheets and they even included all bets played so far this season. This information I don’t really need but it may be helpful if I find something on their summary tabs that doesn’t make sense.
I have only started to look at it but for example, the EPL is showing so far this season a somewhat screwed distribution. For example, the normal draw distribution in the EPL is 24% but so far this year only 21% of the matches finished with a draw. This is quite a strong deviation and has, of course, a negative effect on ‘backing the draw’ if it is part of the portfolio.
I’m going to look at it in more detail later this week and reply to each individually. It is also very likely that I write an article with my findings, of course, without giving away any names or systems.
Hi Soccerwidow,
ok, thanks for your help, I will send you my 2018 summer campaign once I prepare everything, since I did not even start simulations with my 18/19 winter tables.
Hi Jo, I’m sorry but I haven’t started to look at your portfolio yet. Currently, I’m analysing Simon’s portfolio and what I can already say is that Simon has been placing far too many bets below the Average odds and even Zero odds. This leads ultimately to a long time loss!
The absolute main rule in betting is that you must never play any bets below the Zero odds (only very rarely odds below Zero odds may contain value but never when playing a system). You find these odds displayed in the ‘System Picker’ tab.
Simon, as you are probably also reading my reply to Jo, I will send you the report over Xmas but here’s just one example to give you something to think about the next few days whilst you are waiting for my email…
In the EPL you played 57 bets and experienced a low hit rate of 24.6%; if you would have only played the bets that were at least the average odds (3.42) you would have reduced the number of played bets to 23 but increased the hit rate to 34.8%. Instead of occurring a loss of -9 stake units you would be up in profit 5 stake units.
I strongly recommend the two of you, Jo and Simon, to stop placing any bets immediately until I’ve had the time to look at your portfolios and monitoring spreadsheets. I’m really sorry about your losses so far but please better stop now before any more losses occur. That it went all well until mid-October is because there were for some reason fewer bets under Zero odds; the odds turned at this point with more than half of the bets being below Average (and even Zero) odds. Why I don’t know yet but I will think about it and see if I can come up with an explanation.
Another thing what jumps out is, that the clusters are sometimes a little bit too big or too small.
I will send my reports to the two of you in due course and I will also write an article with my findings. In the meantime, I wish you a Merry Xmas! 🙂
Hi Soccerwidow,
Yes, I have seen the comment. Thanks for looking over my portfolio. The point you have raised about the odds I have been placing bets at comes a huge surprise to me. I will have to check this issue myself because I know am I diligent with the bet placement process and always make sure I take odds that are above “zero” odds. Any odds below this, or that are not commensurate with the HO/AO being used, I scrutinize. If something is off, I don’t bet it.
I wanted to put these thoughts down before I forget, and then put the betting issue out of my mind over Xmas.
Taking the EPL system you picked out. My “zero” odds for the HO/OA quotient used was 2.58. So any odds over 2.58 would be as having value. The average odds used as a guide to what to expect for the system was 3.43. I then checked my worksheet and see my harmonic mean odds over 57 bets placed is 3.34. So I’m placing bets well above the zero odds in every single bet. In regards to average odds historically for the entire system, some of my odds obtained are lower, some are much higher.
I then compared this to the system in the EPL you published in the 2017-18 campaign. Your zero odds were 2.52 and your harmonic mean of odds obtained was 3.32. What were the average historic odds for the EPL draw system you used?
So in comparison, with both mine and your system, the figures are almost the same. It doesn’t make sense that I can be placing bets way above the zero odds and not have value, and therefore that be the reason why I am losing.
If we must bet above the average odds irrespective of the zero odds, otherwise we lose long term, then that is a new concept to me, and certainly something that was not specified as a “new” requirement with the new HO/AO quotient approach. It just doesn’t make sense at all.
In the meantime, I will wait for your report, which I’m grateful for, and I will conduct my own investigation to establish the exact relationship between the zero odds of my systems and the odds I actually obtained.
Thanks 🙂
Hi Simon,
please don’t discuss your portfolio in detail on the website. Soccerwidow is for many readers and not for a personal discussion between two people. Therefore, although that is something I normally never do, please let’s change to communication per email.