Understanding how risk can be controlled when betting is sometimes quite a challenge. Learn today how risk can be reduced & controlled when betting on football. Risk management of a portfolio should be an essential part of your betting strategy.
Please note that this article addresses system betting (= a predetermined selection of bets to bet on the same criteria over a longer period of time).
System betting simply means that you are not judging the risk of any individual bet prior to placing it (this would be ‘value betting’). System bettors identify an overall ‘edge’ or ‘advantage’ that is likely to persist over a longer period of time and then follow-through from the start to the finish of a campaign. Of course, there is ‘value’ involved (a ‘mathematical advantage’), otherwise it wouldn’t work.
The examples in this article are our actual picks for the 2017-18 season that were identified using the HDAFU Tables.
What Exactly is a Portfolio?
A portfolio is a package of bets where extensive analysis has determined the choices (picks). Diversifying the portfolio is an essential part of betting strategy with the aim of reducing the risks of losing.
Please do not confuse the term ‘portfolio’ with ‘best timing of placing bets’. A portfolio is planned well in advance of a weekend (or round, or even season) and determines the assortment of bets that are to be placed later.
A portfolio of bets is therefore a varied group of individual bets, not just one particular match on a particular day.
To judge the success of any particular betting portfolio it is necessary to evaluate the performance of all of its systems together as one, not just the individual group members (bets in just one league or system).
What is Diversification?
Diversification is a technique that reduces risk by allocating bets among various leagues, bet types, and other categories such as times or seasons. The rationale behind this technique contends that a portfolio constructed of different kinds of bets will, on average, pose a lower risk than any individual bet (system) found within the portfolio.
Diversification strives to smooth out unsystematic or anomalous risk events (outcome of matches/leagues) in a portfolio so that the positive performance of some bets (winnings) neutralizes the negative performance of others (losers).
The questions that probably arise right now are: How big should my portfolio be? How much should I diversify?
I will answer these two questions at the end of the article but for the time being let us first look at our portfolio for the 2017-18 Winter League season. I will explain step-by-step how I came up with the choices and what my thinking was behind them. This will probably already answer many of your questions.
Our Portfolio for the 2017-18 Season
For the sake of brevity, I am showing only the first 10 European leagues we used in alphabetical order: Austria, Belgium, Denmark, England, France, Germany, Greece, Italy, Netherlands and Poland.
The overall results you will see would have been similar whichever 10 leagues we chose to illustrate with.
For betting, it doesn’t matter which leagues you choose so long as you have easy access to all of them with the bookmakers available to you. A well-balanced portfolio normally delivers the results as expected.
Here is our portfolio for 2017-18:
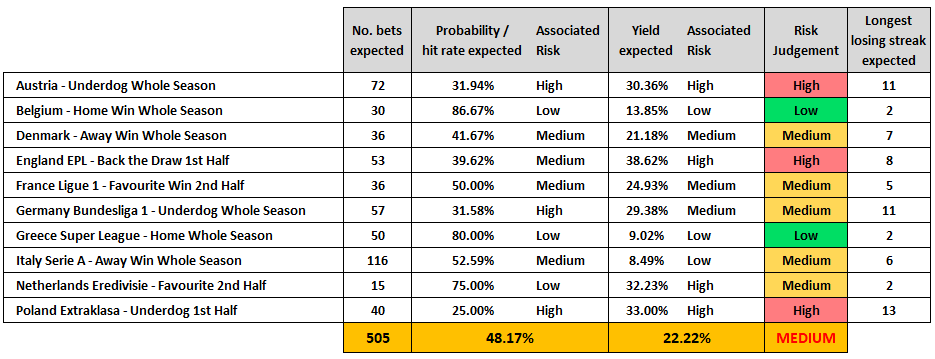 Image 1: Portfolio of bets for the 2017-18 winter league season
As you can see it is a conservative portfolio with a good number of low risk and medium risk systems.
As a side note, this article isn’t about how the individual systems (within a portfolio) are picked. However, for the 53 bets in the EPL, you will find a detailed explanation in this article: Finding a System Using the HO/AO Quotient
For the other nine leagues you will just have to trust that the systems were picked in a similar manner to the EPL example.
Probability / Expected Hit Rate / Risk
The terms probability, expectation and hit rate are all closely related, and express more or less the same thing. The main differences are that before a game starts (or a whole system of bets/portfolio is played) the terms ‘probability’, ‘expectation’ and ‘prediction’ are used but, once results are known, these terms are supplanted by actual ‘hit rate’.
The observed distribution of the past (as displayed in the HDAFU Tables) becomes the probability for the future (= expected hit rate).
Referring to image 1 above, there was an expected hit rate of 80% in the Greek Super League. This meant that from every 10 bets placed, on average, 8 were likely to win. Therefore, the longest losing streak when placing 50 bets in a row was 2 (see article: The Science of Calculating Winning and Losing Streaks). This individual system within the portfolio was evaluated as being ‘low risk’.
On the other hand, the expected hit rate of 31.58% in Germany meant that from every 10 bets placed, on average, 7 were likely to lose. The longest losing streak expected when placing all 57 bets in a row was 11. This is an example of low probabilities, or ‘high risk’ classification.
Losing Streak Observed vs. Maximal Losing Streak Expected
The ‘longest losing streak expected’ is not necessarily the ‘longest losing streak observed’.
For example, in the EPL 2012-17 the observed longest losing streak was 6 in a row and this happened 3 times during the previous 5 seasons.
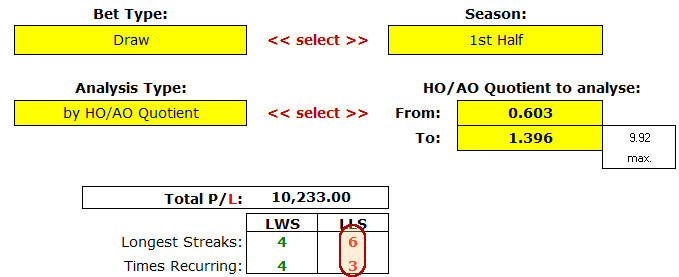 Image 2: EPL HO/AO group 0.603 to 1.396 – Backing the Draw 1st Half
 Nevertheless, to judge the risk for the future you have to allow for the worst-case scenario even if it hasn’t happened for a very long time – one day it will happen, believe me!
It is always safer to prepare for the worst rather than relying on luck.
At the end of this article (image 6) you will see that 2 of the 10 systems (Austria, EPL) reached their expected longest losing streaks, and one system even outstripped its calculated (predicted) expectations (Denmark).
Calculating the Expected Maximum Longest Losing Streak
Here’s a screenshot from the EPL 2012-17 HDAFU Table representing the HO/AO quotient cluster group (0.603 to 1.396) for backing the draw. The expected total number of bets and expected hit rate for the forthcoming season are circled in red.
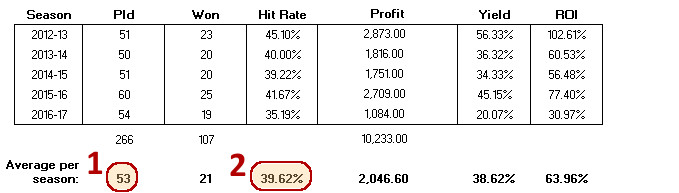 Image 3: EPL 2012-17 HO/AO group 0.603 to 1.396 – Backing the Draw 1st Half
To calculate the longest expected losing streak use the following formula:
n = number of trials (i.e. total number of bets expected)
ln = natural logarithm
P = probability / expected hit rate (for losing streaks: expected losing rate)
| .. | = absolute value or ‘modulus’
Here’s the formula in action for the EPL example:
The winning probability of 39.62% means of course that the losing probability is its inverse:
100% minus 39.62% = 60.38% To calculate the longest losing streak use in Excel the following formula:
=ABS(LN(53)/LN(60.38%)) Read more about the above formula, its use and interpretation in our article: The Science of Calculating Winning and Losing Streaks
The result of our calculations meant that for the 2017-18 EPL season, when backing ‘Draw in the first half’ within an HO/AO Quotient between 0.603 and 1.396, the expected maximum losing streak was 8 losses in a row.
Furthermore, sorting the 2012-17 data falling within this HO/AO Quotient group into rounds revealed that there weren’t more than 4 available bets in any round of matches; sometimes there was only one, and occasionally there were none.
With a losing streak of 8 bets possibly spanning a period of 5 to 6 weeks (= 1.5 months), this system was not likely to be easy on the nerves.
To guard against nerves becoming mass panic, you will need to ensure that your portfolio does not contain too many systems with lower probabilities. Although not very likely, it is quite possible that they may all experience their longest losing streaks at the same time (2017-18 being a case in point, where the season began badly across the board).
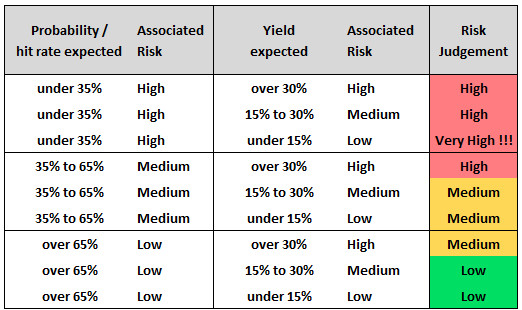
Rules of Thumb to Judge Risk
A high yield ALWAYS indicates high risk!
…Until it doesn’t!
I have included in the example Netherlands Eredivisie (Backing the Favourite 2nd Half) because the analysis came out with a 75% probability of winning. However, the expected yield of 32.23% was exceptionally high for this probability group and there were only 15 bets expected.
Normally, high probability of winning and high yield do not go together. Therefore, it may have been just an observed anomaly because of the small number of matches on average each year in this group.
Nevertheless, because only 15 bets were expected (of over 500 in the whole portfolio) and with an expected high hit rate, the overall judgment for this particular pick was ‘medium’ although the high yield would have normally marked this system as ‘high risk’.
Moral 1: There are no rules without exceptions.
Next rule:
In Germany, the expected hit rate was 31.58% (high risk), whilst expected yield was 29.38% (medium risk)
The combined expectations of hit rate and yield here would perhaps have labelled this system as ‘high risk’ but downgraded to ‘medium risk’ as expected yield was under 30%.
Calculating the overall Probability / Expected Hit Rate / Risk of the whole portfolio
Portfolio compilation and decision-making involved the balancing act of achieving as high an expected hit rate as possible, together with an acceptable yield.
- The overall expected hit rate of the portfolio should be in the region of ± 50% (of course, if you can get it higher, the easier it will be on your nerves)
- An acceptable yield is anything in the region of ± 20%
To calculate the overall expected hit rate of the whole portfolio, list your systems like I have done in image 1 (Portfolio of bets for the 2017-18 winter league season)
- First you multiply the number of expected bets with the expected hit rate for each system, e.g.
Austria: 72 times 31.94% = 22.9968
Belgium: 30 times 86.67% = 26.001
Denmark: 36 times 41.67% = 15.0012
…and so on - Then add them all up:
22.9968 plus 26.001 plus 15.0012 plus etc., etc. .. = 243.2526
- Now divide the result by the total number of bets expected:
243.2526 divided by 505 = 0.4816883 ≫≫ 48.17%
To calculate the overall expected Yield the same calculation applies.
The portfolio example in this article had 505 expected bets over the period of a whole season, with an expected Hit Rate of 48.17%, and an expected Yield of 22.22%.
It was therefore a ‘medium risk’ portfolio.
‘Medium risk’ means that you must be prepared for bumpy rides – substantial ups and downs in your betting bank. But with a sensible staking plan, this shouldn’t mean bankruptcy before the situation picks up again.
Three Scenarios of the same Medium Risk Portfolio with 500 Bets
Despite a ‘high’ hit rate of 48.17% (which isn’t as ‘high’ as you may think) you may experience a betting campaign like this one if you don’t get off to a good start:
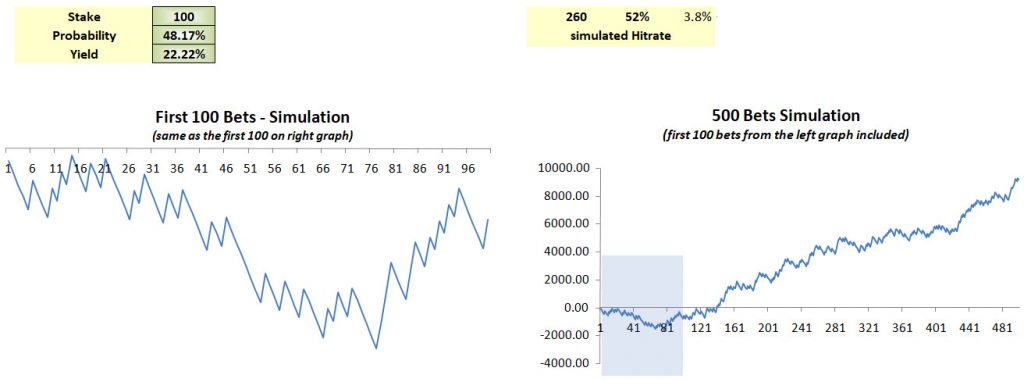 Image 4: Profit/ Loss Scenario I for an expected hit rate of 48.17% and 22.22% yield
However, you could get a good start and a very smooth curve over the whole season.
Please note, these screen captures relate to the same portfolio of bets. Nothing has changed: 48.17% probability of winning; 22.22 % expected yield.
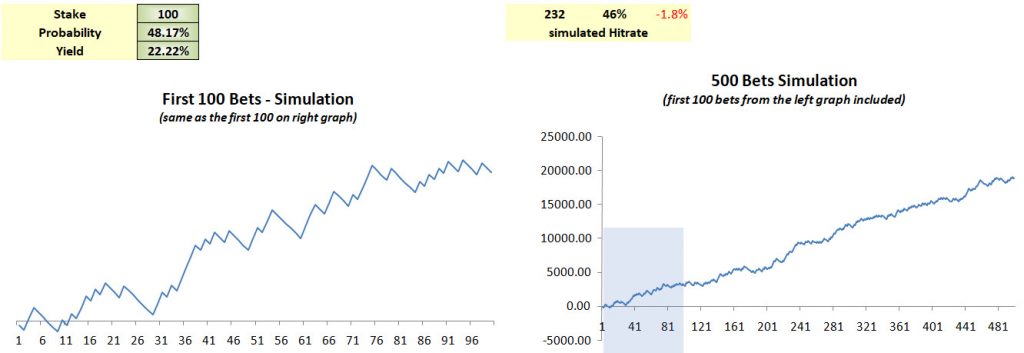 Image 5: Profit/ Loss Scenario II for an expected hit rate of 48.17% and 22.22% yield
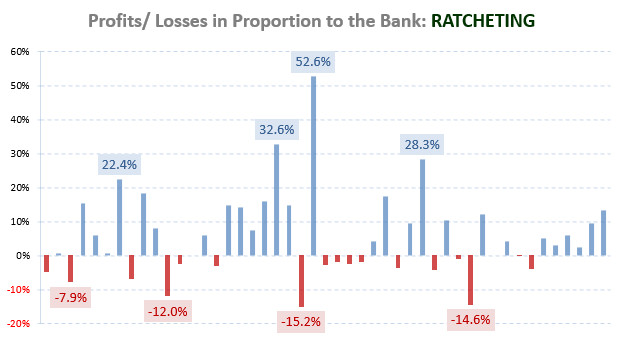
Scenario 3 has an extremely good start (up to bet number 80) and then gives way to a bumpy ride to the end of the season:
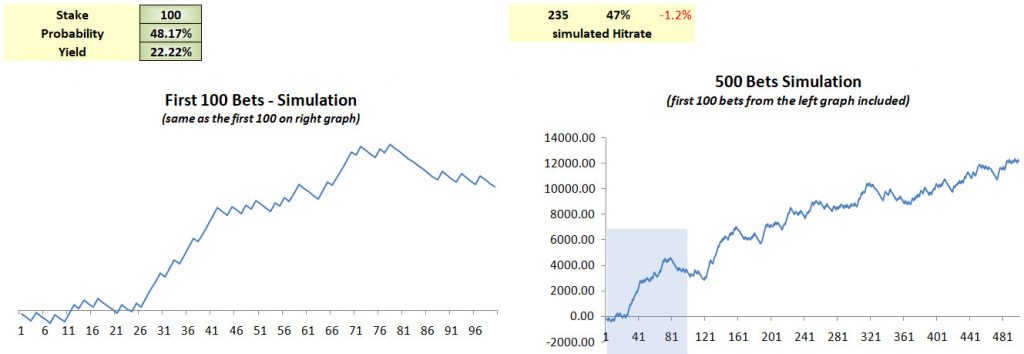 Image 6: Profit/ Loss Scenario III for an expected hit rate of 48.17% and 22.22% yield
Have a think about these profit/loss curve simulations.
The first (unlucky) scenario even has an average hit rate of 52%, much higher than the second and third. However, the second and third are much smoother on the nerves and both have a better financial result at the end.
What I’m trying to say is that you must always remember that you are gambling. Although you are using sound statistics for compiling your portfolio, never lose sight of the fact you are still gambling!
The two very simple rules to negotiate a season with a profit at the end are:
- If you have a sound portfolio do not give up too quickly.
- If you have at the beginning a very good start don’t become over-excited and start increasing your stakes more than originally planned.
Always remember, gambling has a lot similarities with rolling a dice; you may have to wait for ages until the sixes start popping up or you have them all at the beginning and then for a long time none.
The Final Performance of the Portfolio
At the end of the season, the portfolio produced the expected result (the overall hit rate was more or less as predicted) although the leagues themselves within the portfolio performed erratically with peaks and troughs during their seasons.
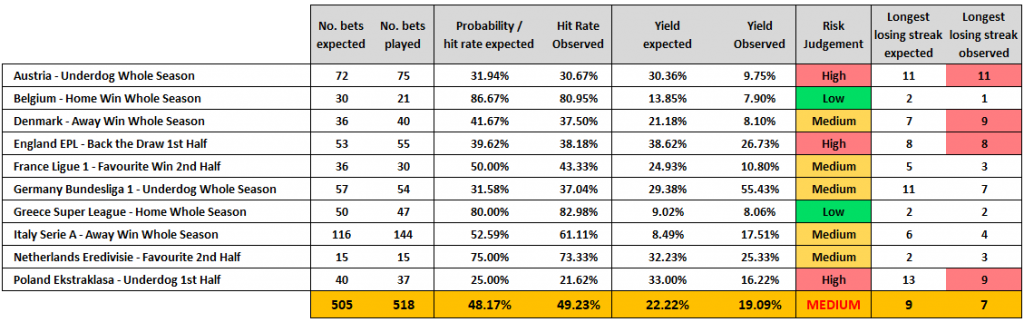 Image 7: Final performance of the 2017-18 winter league portfolio
All three ‘high risk’ systems produced, as expected, very long losing streaks: Austria, EPL, Poland.
Denmark produced a longer losing streak than expected. It started on the 26/8/2017 and continued until 29/10/17 – more than 9 rounds of games! Nevertheless, they recovered to finish with a positive return, although far lower than expected.
I will write more about the final performance of that portfolio in another article where you will also be able to download the whole monitoring spreadsheet including staking and ante post odds movements.
How big should my portfolio be? How much should I diversify?
Betting, in general, is a very unreliable venture and to be able to ‘control’ risk (reduce on losing streaks) a good number of high probability bets is required.
However, the big challenge with football betting is that especially the lower odds (up to 2.5) are often reduced because market demand forces bookmakers to reduce prices for favourites and increase the prices for the opposite bets (underdogs and occasionally draws).
You will therefore find plenty of draw and underdog strategies in the HDAFU tables but unfortunately, these two bet types come normally with very low probabilities of winning (= low hit rate expectation/high losing rate expectation).
And, if you have too many low probability bets in your portfolio and experience several weeks in a row where the favourites are mostly winning, your betting bank may become distressed beyond your comfort levels.
As I have shown you in the example, to get a balanced portfolio of 500 bets requires approximately 10 leagues. If one league doesn’t play according to statistics (e.g. Denmark) another league will hopefully make up for it (e.g. Germany).
Of course, the larger your portfolio, the better.
Reduce on ‘high risk’ as much as you can.
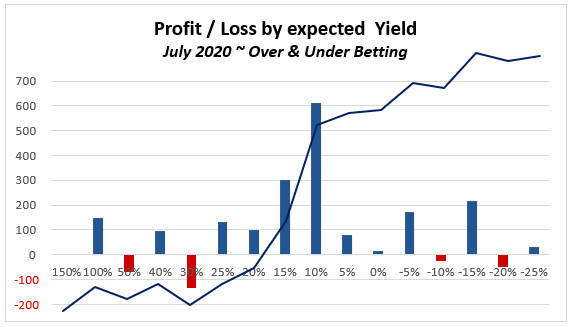
Image 8: Relationship between a systems expected hit rate and its yield
Pay attention that you don’t have too many systems with just 10 to 15 bets in your portfolio as they are much more volatile than systems with 50 bets or more.
However, in the example portfolio, there were only 5 systems with 50 or more bets. It’s not always easy to stick to every rule.
- At least 50% ‘medium risk’ strategies.
- At least 50% of the systems within the portfolio with at least 50 bets (for the whole season/year).
- An overall expected hit rate of the portfolio of around 50%.
- A minimum of 500 bets in the portfolio = an average of 50 bets in 10 different systems
If you can achieve more than 50 – the magic number – in any of the above equations, then your portfolio should have an even stronger chance of succeeding.
Good luck with your betting!
I hope this article has answered the questions we receive about judging the risk of a system identified with the HDAFU Tables, and will help you to construct a well-balanced portfolio. However, if you are still not clear, then please feel free to ask any questions via the comment section below.


Hello you have tips for me in soccer?
Hi Tzahi,
No, we are not a tipping site – sorry!
We provide only the tools to help you identify your own selections rather than having to rely on ‘blind faith’ by paying for a tipping service.
There is never any guarantee that any tipping service provides statistically sound and financially accurate advice.
I would suggest you read the Soccerwidow blog if you would like to teach yourself how to become more productive than any tipping site will ever provide for you!
Good luck!
Hi Right Winger and Soccer Widow,
Is there a way to place bets way before kick-off in every league with the AO/HO ratio ? I mean that how often I’ll have to take time looking for odds to place my bets in order not to always be doing it or having to do it in the middle of the night ?
I would like for example to say that check odds and place bets between 8 and 10 PM on Fridays and another interval of time on Sundays for example and that’d be it for the most. I’m willing to take the needed time to analyses tables and assemble my portfolio once or twice a year but after that I would like just to place bets and monitor the results and make necessary adjustments. Is that feasible?
And is it really possible / recommended / ok to enter several days / weeks after the season has begun and/or take a break and comeback during a season? Because some articles indicate that we can and some don’t so I was wondering.
Thanks a lot!
Oliver
Hi Oliver, the timing of bets is a very frequent question that troubles many punters…
Unfortunately, there are no rules! No rules that apply to all leagues in this world and can be followed blindly. If there were rules, it would be easier for traders to find a money-printing machine.
The only thing you can (slightly) generalise is that the odds for the home win (especially for the favourite) show a tendency for reducing prior kick-off. Therefore, if your portfolio contains backing favourites at home it is better to place the bets earlier than later.
For HO/AO Quotients over 0.500 (home odds around 2.0 and higher) the draw odds too show a tendency for shortening (going down) prior kick-off. Again, placing bets well before kick-off seems to be more beneficial.
Away odds don’t really seem to have any tendencies. The odds movements seem to be pretty random, but higher underdog prices are usually available closer to kick-off.
What we recommend is…
Concern about the right timing of bets is unnecessary. Betting isn’t an exact science. As long as you make sure that the mathematical advantage is on your side (playing above Zero odds) you really need not worry.
I hope this answer helps you get to your bed a little earlier rather than staying up to monitor games in leagues with unsocial hours!
Soccerwidow
P.S. The articles you are probably referring to that indicate bet placements as close as possible to kick-off are old articles. This was based on trying to match the simulations, which were then all using odds at the close of the ante-post market. It was a painful exercise to ensure such a solid benchmark by checking the accuracy and timings of each set of odds, but our research since has shown that it really doesn’t matter when you place the bets. We all learn from experiences…
Sorry for the confusion; we have to mark the older articles as being “archived”. I will make a note to do that as soon as possible!
Hi Right Winger and Soccer Widow!
I read a lot of your articles and I am planning to purchase your last available HDAFU tables (2013-17 if I’m not mistaken).
Just one concern : as there is a price for every covered league, how can I analyse a system in order to include it in my portfolio without buying it ?
I mean, I would be glad to buy only the systems that I will include in my portfolio and drop the other ones.
If I buy a system, analyse it and find that it’s not fitting I guess I’ll lose some time and money. On the other hand if I could buy only the systems that I will use after finding a value it would be great !
Or are you suggesting buying at least ten, do the analysis and then buy a few more if my portfolio does not meet the requirements (expected yield around 20% and expected hit rate around 50% with medium overall risk) ?
What are your recommendations on this and what is possible to meet my request?
Thanks and have a nice day!
Oliver
Hi Oliver,
You will find enough opportunities in each league to allow you to build the required portfolio (expected yield around 20%; expected hit rate around 50%; medium overall risk).
The only limitations you will have, and these are questions only you can answer yourself, are:
– Which bookmakers are you going to use?
– Which leagues are covered by these bookmakers?
– Which times do you prefer placing your bets?
– Which leagues are compatible with your time preference?
You can really pick any league. There are no limitations. The fact that we offer such a wide choice is because our client-base is worldwide – everyone has different tastes and will use their own selection of betting accounts.
Therefore, you can safely buy any 10 HDAFU tables that best suit your interests. Each table contains something potentially lucrative. Every league has a profitable HO/AO or odds cluster zone that is profitable.
Bookmakers ensure that each league is profitable to them: They manipulate the odds in each league according to punters’ preferences to ensure profits. This means that there are clusters, perhaps less popular with punters, where bookmakers increase their odds (prices). This phenomenon creates the ‘sweet spots’ in back-betting systems for more precise targeting of those profitable areas.
It is not mathematically possible for the bookies to price the entire book of events in their favour – the tables show what to avoid (the bookies’ profit zones) and what to investigate (where the bookies have no option but to over-price an outcome).
I’m sure you will find something that works for you!
Enjoy your day too!
Soccerwidow
Dear Soccerwidow,
first of all congratulations for your book “Fundamentals of sports betting”, it is simply amazing, I bought it about three months ago, I have not finished it yet but I already gained a big knowledge, the betting for me has become more than gambling but rather a intellectual challenge. I just need now to deepen the knowledge in building profitable portfolios but I would also start to study the HDAFU system, and I would like to buy the HDAFU product, just a question, does it provide with explanations further than just tables? is it built like the fundamentals of sports betting?
Thank you and best regards.
Hi Giampietro,
I’m very pleased to hear that you enjoy the course book so much. Thank you for this feedback! 🙂
Regarding the HDAFU tables… Unfortunately, there isn’t a course book yet written, at least not ready for publishing. But you will find a good amount of explanations here: 1×2 Betting Category
Hope this helps.
Hi Soccerwidow,
I’m really impressed with some of the articles that you have written on here and I hope to continue learning from your output. Every time I come on this site, i learn something new…
What i’m looking at right now is probably suitable for this particular page, assessing what might happen next season based on previous results (to determine if a system merits inclusion in the portfolio).
From the cluster workbook, I know that you use FD data and 5 year averages to predict what will happen in the coming season, but have you ever considered using something like the FORECAST() function in Excel?
If yes, could you say whether or not it was closer to meeting expectations than just the simple averages, and if not, would you be willing to check it out and let me know?
The FORECAST function can be used with pretty any of your fields, so in addition to forecasting number of bets, pts, average odds, etc could be forecasted.
What do you think?
Thanks for a great site!
The FORECAST() function uses the known y-values and the known x-values to predict either the y-value or the x-value. In effect it’s a line graph and the function returns a value on the graph.
The name of the function ‘forecast’ is therefore probably a little misleading and no use for what I do.
Please use for further questions of this kind either the Frequently Asked Questions – Over Under Cluster Tables or Frequently Asked Questions – Fundamentals of Sports Betting Course or Frequently Asked Questions – Make the Most of Your HDAFU Tables. Choose the FAQs that are closest to the product you are referring to.
Have to laugh at myself for making that mistake, you’re entirely right, the FORECAST() function would have no application here…
Hi soccerwidow,
I’ve had a chance to assemble the systems I’ve identified into a portfolio based on the criteria you have set out. It’s like assembling a puzzle trying to get all the pieces to fit. So far – based on analysing 16 leagues I have found a few whole season systems and then 1st and 2nd half systems, giving 26 total systems. 5 are low risk (18.52%), 15 are medium risk (55.56%) and 7 are high risk (25.93%). Would that setup be unbalanced in relation to the high risk side? Do I need to increase the low risk side? One thing I’m having trouble finding is the 65% plus hit rate systems that also have a reasonable profit. Do you have any pointers where I should look for these?
Thanks.
Hi Simon, I think that you’ve got a typing error in your low risk… 18.52% cannot be.
Please do a list similar to the one I did… number of bets, probability, expected yield.. judge each system by risk as explained in the article and then calculate the risk of the whole portfolio.
Finding 65%+ hit rate systems is a real challenge… Look at Belgium, Greece and Spain home wins, just to give you a few pointers… check other leagues as well in which the 1st & 2nd half are having similar curves (more or less)
Hi soccerwidow,
I did mske a chart similar to yours. The 18.52% figure is the percentage of my systems I ranked as low risk. I typed 26 total systems but that should have been 27. So….5 systems out of 27 are low risk. 15 are medium risk and 7 high risk. What I was wondering is would you suggest I need more low risk here or are things balanced as is?
I see what you meant now about calculating the risk of the entire portfolio rather than worrying about the number of systems in each category of risk. What I have so far is a hit rate overall of 45% and yield of 21%, which seems ok. Getting the hit rate to 50% is still possible.
I took a look at the Belgium league as suggested and for example with the Whole season Home Win there are a couple of steadily rising areas of the graph in the small ho/ao quotient region. The thing is each set of inflection points results in a system with profit around 1600 to 1800 for the 5 season period – not anything to shout about. The hit rate is 65% plus for both, yield 10 to 12%, 25 bets per system. As well, the zero odds are equal to or lower than the lowest average odds predicted for the system.
Is there any reason I should not employ both systems here? Unless there is a reason to not do so, it makes sense to me to maximize the profit I can derive from the 65% hit rate range, which gives me the low risk system I need and also the number of bets of higher hit rate to balance out my higher risk systems. As mentioned I’m not finding an awful lot of 65% hit rate systems with substantial profits.
Belgium, go only for the first group (up to HO/AO 0.185), the second may be just an anomaly.
Otherwise, from the 27 systems you have, check if you haven’t too many. I wouldn’t do more than one per league, especially not in the second leagues. I would probably even limit myself to 15 systems within the portfolio in total and pay attention that the expected number of bets per system is at least 30 (if I cannot find enough with 50+ bets expected). However, I’m a very risk-averse person; I prefer steadiness but have to accept low margins in exchange. Right Winger may have advised you different.
How successful were you actually last season with your portfolio? Learn your lessons there!
Soccerwidow,
I’m glad you published this today. Have read it over once already and will go over some of the sections again, but am looking forward to applying this info to the systems I have found. It’s really good info and will take a lot of the uncertainty out of putting together a portfolio alone.
Thank you.