Calculating odds is a science, and statisticians/analysts, who can do the job competently, receive good annual salaries (GBP 50k-80k; €60k-95k: Quantitative Analyst).
These jobs are paid so well because the results form the backbone of each bookmaker’s business. The better an analyst understands his job, the bigger the potential profit margins for the bookmaker. In order to make long-term profits, a good understanding of odds calculation is therefore also essential for any bettor.
Probability of Football Match Results
Odds are based on the probability that a certain event occurs: for example a home win, a draw, or an away win in football games based on historical data. But what is the current probability of each of these outcomes and how are percentages computed? Also, from where does one get the data from?
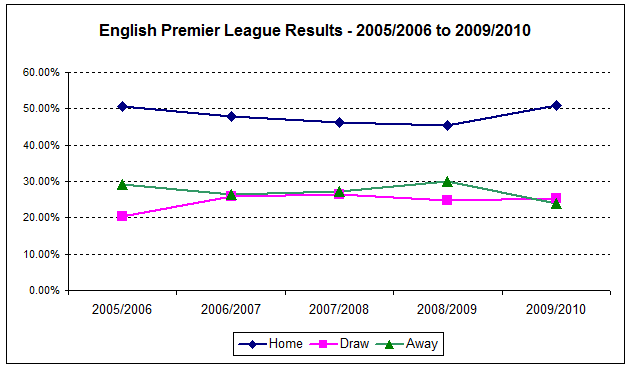
The following diagram shows the distribution of results for the English Premier League for home win, draw, and away win during the last five complete seasons:

Looking at the graph, one can see that the distribution of results is rather similar for each year.
Without considering factors such as matches between strong or weak teams, teams under new management, rain affected games or anything else one can think of, fixtures in the English Premier League, according to the statistics, show on average 24.46% of all games were drawn, 27.35% ended in an away win and 48.16% were won by the home team:

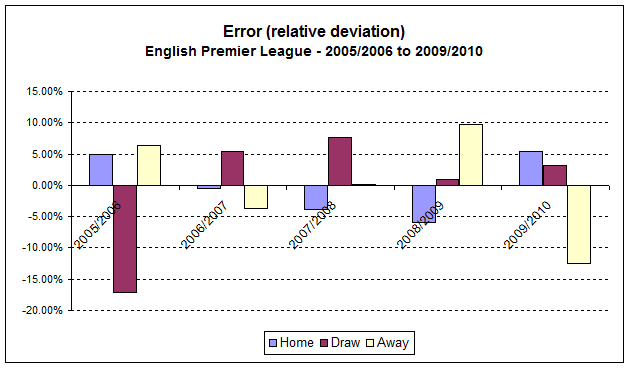
Only twice (of 15) did results fall outside of ± 2% residual from the average figures, being drawn games in 2005/2006 (-4.2%) and away wins in 2009/2010 (-3.4%):

Comparison of the expected results with observations
Now, it is time to compare the expected results (based on the average results of 5 years) with the observed results of the current 2010/2011 season up to 19 February 2011:

There are quite large differences from the expected values (averages or means) to the observed results (actual results for 2010/2011) in both the drawn matches and away wins categories. However, I am pretty sure that by the end of the season, the figures will adjust themselves more in line with the 5-year average figures and that the differences showing now can be explained by having compared only two-thirds of the current season with the average results of a full-year. However, this indicates that there is an uneven distribution of home wins, draws and away wins at different times over the season, which should balance out by the close.
So, if the odds of a single match are calculated, this seasonal effect must be considered, but for this article and for your general understanding, I shall not complicate matters by touching on it further.
Mean (average value), Errors and Residuals (relative and absolute deviation)
For those of you with difficulties understanding what arithmetic mean and errors/ residuals are, herewith a few additional explanations with examples:
- Arithmetic Mean
The arithmetic mean, often referred to as simply the mean or average when the context is clear, is a method to derive the central tendency of a sample. In probability theory, the mean is also called expected value (or expectation, or mathematical expectation, or the first moment).
The mean (average value) is a known value and can therefore be used as an expectancy value.
Simply speaking, one can use the mean to predict future events (e.g. the distribution of football results) quite accurately.
Example using the 5-Year English Premier League table above for home games:
(50.53% + 47.89% + 46.32% + 45.29% +50.79%) divided by 5 = 48.16% (= mean/ average)
Therefore, it “is expected” that the 2010/2011 season will produce 48.16% home wins. - Errors and Residuals (relative and absolute deviation)
Statistical errors and residuals are two closely related and easily confused measures of the deviation.
The error of a sample (e.g. observed football results for a certain period of time) is the ‘relative’ deviation from the function value (mean), while the residual is the difference (absolute deviation) between the sample and the function value (mean).For example, the RESIDUAL (absolute deviation) for home wins during 2005/2006:
50.53% (2005/2006 home wins) minus 48.16% (average value for 5-years) = 2.37% (= residual)For example, the ERROR (relative deviation) for home wins during 2005/2006:
2.37% (residual) divided by 48.16% (mean) = 4.92% (= error)The error (relative deviation) is the proportional deviation between the observed value (the actual results) and the expectancy value (the mean/ average of all years). The error (relative deviation) puts residuals into relation to each other.


The selection of tips, which I published on 12.2.and 19.2.2011 (with a success ratio of over 32% profit both times), was based on observations of deviations, i.e. on “errors”, which are completely natural in a row of expected events.
The odds makers cannot always fully consider deviations, and therefore, on a long-term basis, there are profitable picks available. By researching and analyzing the statistical trends and then looking more directly at the individual games, it is possible to see deviations from the normal distribution, and from there, obvious “errors” in the odds.
This series of articles is concerned with the approach for selecting plays and identifying “errors” in market odds. Also, I publish weekly picks, which are made on basis of this analysis, and expose these errors to a practical test.
Calculation of Odds
Odds available in the market are based on the statistical expectation of an event, in other words, the ‘average’ value of historical football match results (= known value).
For simplification and explanation, I am now assuming that odds are calculated arithmetically through the season without considering factors such as the strength of the teams involved and any other aspect of the individual match. Certainly this is not how the odds makers calculate their odds. Genuine mathematicians among my readers may shake their heads now, but in the following example I am surmising that the odds for each match are alike during the entire season.
Then the odds would look as follows:

The formula for the computation of odds is as follows:
Home win: 48.16% probability results in a price of 2.08 (1 divided by 48.16%)
The minimum odds are computed as follows:
Home win: 2.08 calculated odds multiplied by (1 minus ‘error’ 4.14%) = 1.99
The maximum odds are computed as follows:
Home win: 2.08 calculated odds multiplied by (1 plus ‘error’ 4.14%) = 2.17
Translated into practical application for the bettor either one picks matches where the home team can be laid (not to win) at a price under 1.99 and/or matches where the home team can be backed to win at odds higher than 2.17, in order to make profit every season.
Calculation Example English Premier League
As already stated, my example assumes the odds for each match are alike during the entire season, which is obviously wrong. One only needs to consider matches for a single weekend to realize that each game has different odds for the various possible outcomes. Nevertheless, for the general understanding of odds mathematics, I shall retain this obvious implausibility.
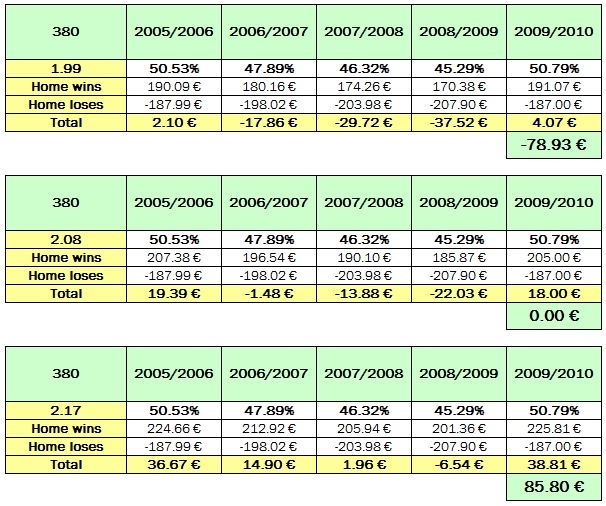
The English Premier League has 380 matches during a season. If one has a statistically based system, then one must naturally bet on all matches as it is unknown which games will end in a home win, draw or away win.

If one lays all the home teams at the minimum odds (1.99), a profit of 78.93 € is made, and only in the years 2005/2006 and 2009/2010 is a loss made.
If a lay bet or back bet is put on every home team showing odds equal to the calculated average of 2.08, the result is exactly break-even with exactly 0.00 € profit/loss.
If one backs every home team with 1.00 € showing the 2.17 maximum odds, a profit of 85.80 € is made, apart from in 2008/2009 where a slight loss would be realized.
Derived rule: One cannot obtain profits on a long-term basis if one only ‘lays’ or ‘backs’ to the average odds (i.e. the statistically expected result). One ‘lays’ if the odds are lower than statistically expected and ‘backs’ if the odds are higher than the average odds.
Apologies for such a large quantity of maths and statistics, but I hope very much that this article helps your understanding of bet mathematics.
In my next articles I will penetrate more deeply into this subject and will describe how to find market deviations, what conclusions can be drawn from them, and how matches are selected for betting purposes.
In order to be able to follow my articles and explanations however, one must perfectly understand the terms average value, errors and residuals (relative and absolute deviation) and the formula for odds computation.
Therefore, I implore you all to do your homework and check everything using your own examples and your own preferred football leagues.
If you found this article useful and would like to purchase an instructive and comprehensive book then check out our Fundamentals of Sports Betting Course: Betting on Over / Under ‘X’ Goals


How do get form factor figure?
Hi Mathew,
Can you please be a little more specific – what exactly is it you are trying to figure out?
Hey. i wanna know how I can use probability to predict the putcomes of football bets. Mind showing me how?
Hi Derrick, we’ve got a course that teaches probabilities to predict outcomes in detail: The Science of Football Predictions
The course has already helped many people; so it will probably also be of great help to you. Good luck! 🙂
Hello
I have been using some data like
1. Average Home Team goals,
2. Avereage Home team conceeds
3. Average scored by Away Team
4. Average Conceedes by away Team
I also use:
1. Attacking rating
2. Defensive Rating
How can I combine these statistics to get me an idea of expected result.
I am aware that per chance things can change
Erny
Hi Erny,
I’ll have to think about that and add your question to the 1×2 course I have been planning to write for a long while, especially the attacking/ defensive rating… No idea, to be honest, because I don’t even know where I could get enough data from to analyse it properly.
Generally speaking, from a statistical perspective, football matches do not occur frequently enough. For example, looking at a single league such as the German Bundesliga with only 306 matches per season, a relevant sample size is never going to be large.
The plain truth is that any football league is simply not large enough to generate a significant amount of completed match statistics per season. This means that the standard deviation (margin of error) is always going to be relatively large…. and attacking/ defensive rating… it’s only the last few matches, isn’t it?
I probably wouldn’t burn my fingers with it.
If odds are 2.0 and 3.12 what is possible outcome
Hi Kelvin,
Odds and ‘possible outcomes’ are really connected. Bookmakers seldom price ‘true’ probabilities.
Here’s an article on this topic: How Bookmakers’ Odds Match Public Opinion
If you prefer videos, here are a few:
Over Under Clusters Cluster Tables – Calculate ‘Fair’ Odds
1X2 Home — Draw — Away: Expected Odds Calculation & Setting of Market Prices
if the home team have advantage in the odds ?
for example odds are 2 but this home team get 1.75 ?
Hi erez, I don’t understand your question. Sorry!
Generally speaking, home favourites are mainly overpriced, meaning that bookmakers price them at a higher chance to win than their true chances are. For example, odds of 1.75 stand for a 57.1% chance to win, whilst odds of 2.0 for a 50% chance. If bookmakers offer 1.75 odds for a team which should be actually priced at 2.0 then they are ensuring that they have the mathematical advantage on their side.
You may be interested into our HDA Simulationtables. Just have a look.
Hey,
I just came across an app that offers the chance to win 50,000 to correctly predict the odds of two entire leagues.
As an example it says if I can correctly predict 100% premier league results this weekend (10 games) + (10 games of the Spanish League)
What is the average chance per game or the chance winning the 50,000?
Do you have to predict the expected odds (antepost), or predict the actual results which will be played? These are two completely different things.
The minimum odds are computed as follows:
Home win: 2.08 calculated odds multiplied by (1 minus ‘error’ 4.14%) = 1.99
The maximum odds are computed as follows:
Home win: 2.08 calculated odds multiplied by (1 plus ‘error’ 4.14%) = 2.17
am i just being really stupid beacuse i cant seem to get these same answers when i do this sum??
many thank!
scott
Hi Scott, here’s the calculation a little bit more in detail. Hope it helps.
2.08 calculated odds multiplied by (1 minus ‘error’ 4.14%) = 1.99
1 minus ‘error’ 4.14% >> 1 – 0.0414 = 0.9586
2.08 × 0.9586 = 1.9939 (rounded: 1.99)
2.08 calculated odds multiplied by (1 plus ‘error’ 4.14%) = 2.17
1 plus ‘error’ 4.14% >> 1 + 0.0414 = 1.0414
2.08 × 1.0414 = 2.1661 (rounded: 2.17)
Best wishes,
Soccerwidow
hi soccerwidow
i m getting into sportsbetting,i figured out that i might bet on soccer becouse its the sport that i know more than the others,so far so good. when i started to surch on the internet information for betting i get a lot,and i mean a looot confused,there is no precise information, everyone says diffrent shit and i m far away from descovering hot all this works
i found your blog and strarting to read it,you talk about the analysis of the match,analysis for the odds and other things,is this the way professional sports bettors bet? for me to bet do i need this tools? if i have to,can i find this tings on the internet and learn them? when you find a site with odds,isn t it the same as you do you r own odds,saves so much time..so,how can i learn all this things on internet? and what are the really main thing i have to learn in order for me to bet? please help me cuz i m a lot confused and i see you are truly an expert in this so thanks if you answer my questions
Hello guys! I am looking for the acceptible methods to calculate probability chances “1 x 2” on football matches. I read a lot of articles, but there are no useful information that can help me. I started to investigate probability theory myself and I freezed after some calculations.
Let imagine we have match between Chelsea and Liverpool. I understand how calculate probabilitly for each team. I took last ten Chelsea’s home matches and last ten Liverpool’s away matches. After simple calculations(win/10; draw/10; lose/10) I received:
P(Chelsea win at home) = 0,55;
P(Chelsea draw at home)=0,35;
P(Chelsea lose at home) = 0,10;
P(Liverpool win away) = 0,20;
P(Liverpool draw away)=0,55;
P(Liverpool lose away) = 0,25;
But I could now understand how to use this calculated data to predict match Chelsea – Liverpool. I tries to apply sum and multiplication theorems, but there could be incredible result, for exmaple over 1. I definetly understand that this calculation would be very approximatly and that there are a lot of parameters that affect on football result, but I think that it could be useful to predict match. Thank you for any help!
Hi Ineedscore, have a look at our Value Calculator: True Odds & Value Detector: League Games with H2H History as it may help you to answer your question.
There is no need to apply any sum or multiplication theorems. It’s far less difficult that this.