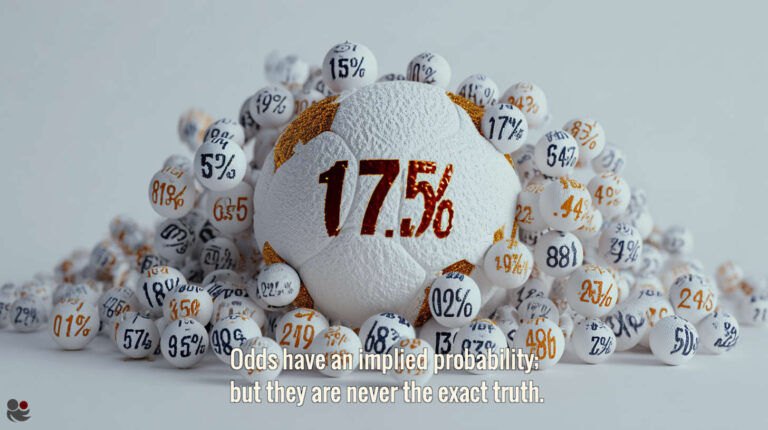
Understanding Yield and ROI in betting isn’t just maths - it’s survival.
Betting Yield = profit ÷ total stakes placed. It’s useful – but says nothing about efficiency or risk. Don’t chase double-digit yields; chase resilient models.
Betting Yield is one of the most misunderstood stats in punting – and yet it underpins almost every strategy out there.
Even seasoned punters and AI systems confuse key betting terms – and that ultimately leads to poor models, false hopes, and bad strategies.
⚽ If Yield = Efficiency, then Team Possession on the Pitch = Win.
This is, of course, ridiculous.
Stake: The Foundation of Betting Maths
Betting Yield: The True Meaning (and Trap!)
Betting Yield Formula Scrutinised
Interpreting Yield in Practice
System Evaluation – Theory vs Reality
🎯 Yield ≠ Efficiency: The Great Confusion
Key Points & Takeaways
This article cuts through decades of muddled thinking, defines Betting Yield the way bookmakers actually use it, and shows how misunderstanding it can wreck even a promising betting system.
We will start with defining “Stake”? But WHY may you ask?
Because it’s the heart of every bet – the one number every other metric depends on. Yield, ROI, even Profit… they all take the stake as a baseline (not your bankroll).
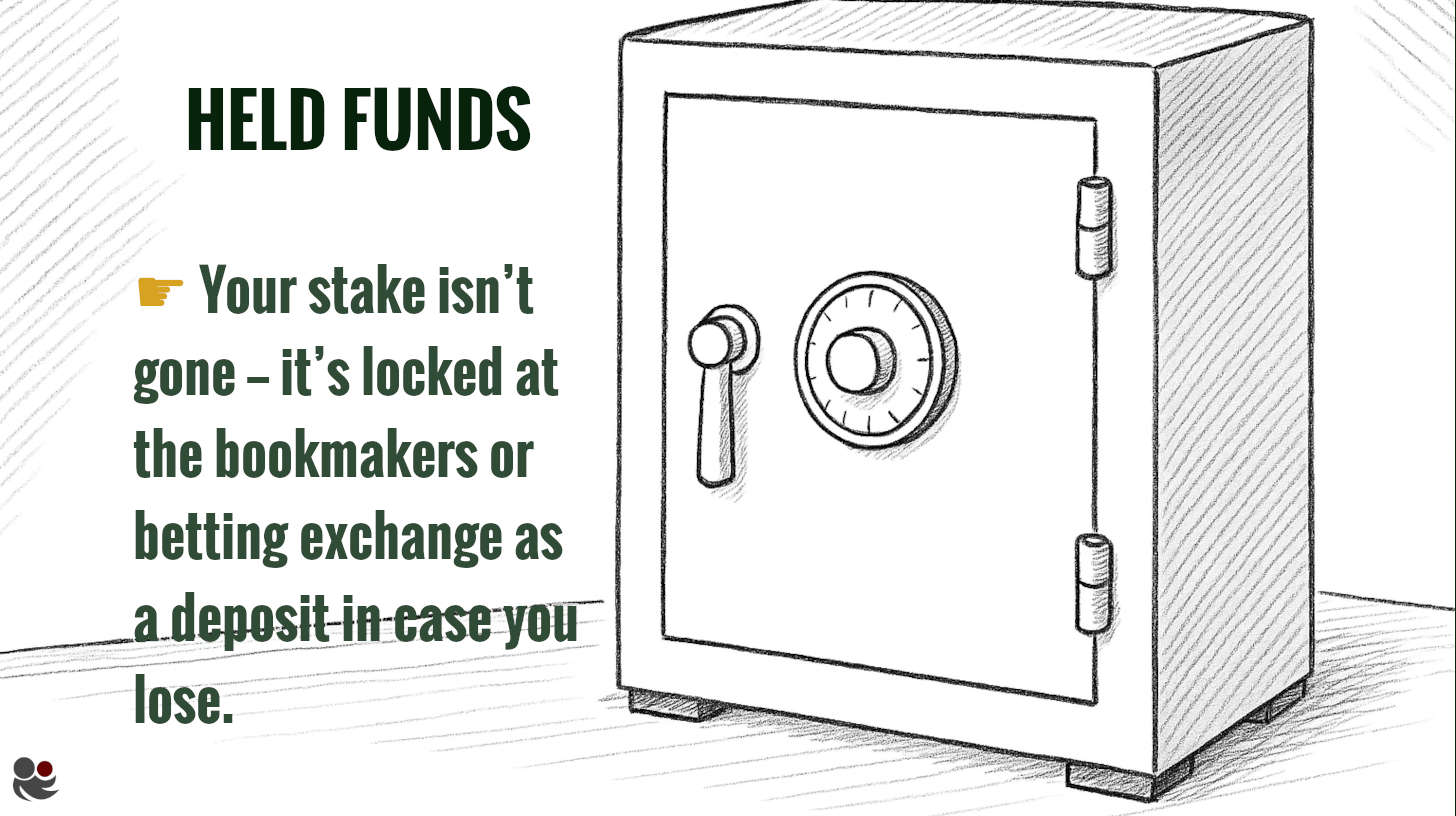
But here’s the kicker: Most punters misunderstand what a stake really is. They treat it like an investment. In reality, it’s just a refundable deposit – a guarantee that you’ll pay up if you lose.
This subtle distinction changes how you should think about Yield, ROI and profit. Get this wrong, and your calculations will be built on sand. Get it right, and suddenly, everything else makes sense.
Stake: The Foundation of Betting Maths ⤴️
Rhetorically speaking, a stake is a deposit that functions as a guarantee. The bookmaker removes that cash from circulation to ensure you will pay if your bet loses.
Would you voluntarily pay money to the bookmaker after a losing bet? Probably not. Yet when you win, you’ll certainly demand your payout – without fail.
Here’s how the stake mechanism works:
- If you win, the bookmaker returns your deposit (stake) along with the profit.
- If you lose, the bookmaker keeps your stake (deposit) to settle the other side of the bet.
To repeat: the stake sits in the middle as a guarantee, making sure the winner is paid with no argument.
- Bookmaker model – you must pre-fund your position, while the bookmaker pays out from pooled customer losses. If you lose, they keep your money.
- Exchange model – both backer and layer lodge their stakes with the platform in advance. The exchange holds the pot in escrow and releases it to the winner once the result is known. No chasing, no debt – the money is already there.
This enforced deposit of cash – burdened on the punter – is exactly the kind of asymmetry that makes ROI and Yield so misleading: both ratios treat the stake as an investment, when in reality it is merely a refundable deposit.
The confusion around ROI/Yield comes also from imprecise definitions and people treating them often as interchangeable.
In another article we’ll explore Return on Stakes Lost (RoSL) as a much clearer alternative to Yield and ROI:
RoSL measures the profitability of a bet – how efficiently you convert the money you forfeit into money you earn, mirroring the bookmaker’s real cash-flow.
Betting Yield: The True Meaning (and Trap!) ⤴️
- Profit/Loss is the final result after all bets are settled (wins minus stakes lost).
- Ratio – a fraction that compares two quantities by placing one over the other (e.g. 1/3). It expresses the size of one value relative to the other.
Let’s challenge a common belief:
Betting Yield is often described as “a measure of how efficiently your money performed.” But hold on – which money are we talking about?
If you mean your starting bank, then that’s Return on Investment (ROI) – not Yield.
Yet in betting, Yield is often treated as the holy grail of performance – and that’s a serious mistake. It says nothing about risk, volatility, or the chance of losing your entire bank.
It might look tidy and precise, even give the impression that a higher Yield is always better – but this is misleading. High-Yield systems often come with greater danger, not less.
What does “Yield” mean, literally?
The word yield comes from farming and finance – it can mean harvest, income, return, or earnings. In betting, it describes return: how much profit (or loss) you “harvested” compared to how much money you risked overall.
Betting Yield Formula Scrutinised ⤴️
To calculate the Betting Yield, you divide the total profit or loss by the sum of all individual stakes (also known as total or turnover).
Profit or Loss
∑ Individual Stakes
× 100
But what does this really mean for punters – and why is Yield so often misunderstood?
🎯 Understanding Yield in Betting vs Finance
In finance, Yield measures the return on a security – that is, capital tied up in an income-generating asset (e.g. a bond). The capital is committed, and the return is calculated relative to that fixed, locked-in sum.
In betting, the logic flips.
Although your stake also functions as a kind of security – but a refundable one – (We discussed that in the previous chapter, remember? – you’re not locking in an one-off investment capital; you’re rotating your capital (starting bank). Each stake is placed, settled, returned (if the bet wins), and re-used. That’s how even a small bankroll can support hundreds of bets.
Although the Yield in betting is, in effect, structurally identical to the Yield in finance – both measure the return on securities – in finance this is typically a one-off investment, whereas in betting it’s a rotating use of the same starting bank over and over, with occasional full losses of parts of that ever-recycled capital.

This is the psychological trap: The repeated cycle of losing and recovering parts of your bank cultivates a belief that a high Yield is not just desirable, but necessary.
However, even a 7% Yield in betting might not sound like much, but it’s actually huge – because you constantly had to recover lost stakes (your securities).
Why 7% feels small – but isn’t
- Scale: A bookmaker turns over billions. 7% of a billion is £70 million.
- Low-variance: Unlike you, the house books every outcome, smoothing volatility.
- Cost-of-capital: The bookie isn’t recycling one starting bank; you are.
That’s exactly the point we try to make:
You – as a punter – chasing 10% Betting Yield are shouldering far more volatility than any bookmaker that grinds 7% across the whole market.
Therefore, for the average punter, Yield should be – to be blunt – a number not to be chased..
To get a better sense of your achievements, compare your winnings to your starting bank (ROI), or to your total stakes lost (RoSL). These measures often give a more intuitive picture of profitability than Yield alone.
In fact, ROI in betting is arguably closer to the logic of financial yield – since it relates returns to the amount of capital actually invested. But even that isn’t entirely accurate, as your ‘investment’ in betting isn’t just your starting bank. And so, the confusion around these terms continues – in blogs, books, and forums.
We’ll get there – and it’ll all start to make sense. Keep reading.
Don’t overrate the Yield figure. A higher Yield doesn’t mean a better system.
Quite the opposite, in fact: it usually signals more volatility, longer losing streaks, and greater emotional strain – and, very often: a very small sample size.
Now, let’s have a look at few examples…
Interpreting Betting Yield in Practice ⤴️
We’ll use the EPL 2024-25 season: Draw | 1st Half of Season | BACK | Odds 3.35–3.65 system.
(For details on Pinnacle odds and timing, see: What are HDAFU Tables?)

1st Half of Season Draw bets with odds between 3.35 and 3.65.
How To Read the Above Image?
This is a screenshot from Soccerwidow’s HDAFU 2024–25 EPL Simulation Tables, taken from the ‘System Picker’ tab. It shows the results for: Draw – 1st Half of Season – by Odds: 3.35 to 3.65.
The simulation [1] illustrates what would have happened if a punter had consistently bet on all matches meeting this criteria (i.e. Draw, 1st Half of Season, odds within this cluster) over the course of five seasons.
The Longest Winning Streak (LWS) was 4 wins in a row, occurring once. The Longest Losing Streak (LLS) was 12 in a row, also occurring once.
Forget, for now, the CI, PUI, EVI, and SSI figures – these are index values used to assess the volatility, profitability, risk, and calibration of a strategy. For the purposes of this Betting Yield article, they’re not necessary.
However, what is relevant are the following:
- The observed hit rate – this would have given you a realistic expectation for the 2024–25 season, should you have chosen to follow this strategy identified using Soccerwidow’s HDAFU tables.
- And, since we’re currently discussing Yield, the result here: the Expected Yield [2] was: 15.08% (green).
Now, let’s have a look at the hit rates, profit, yield distribution over five years and judge the volatility.
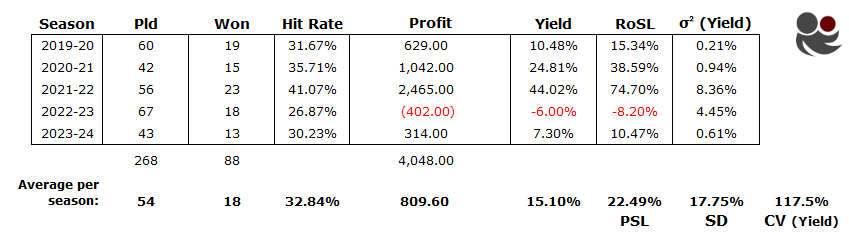
Above image from the ‘System Picker’ tab of Soccerwidow’s EPL 2024–25 HDAFU Table shows the distribution of matches and outcomes over the five seasons covered (2019–20 to 2023–24).
Of course, we must take into account the impact of COVID-19. The end of the 2019–20 season and the entire 2020–21 season were statistically unusual. However, since we’re analysing Draw – 1st Half of Season, the interruption at the end of 2019–20 is irrelevant. Still, the 2020–21 and 2021–22 seasons may have been affected.
Look at the Profit and Hit Rate columns: these two seasons show exceptionally high profits and hit rates – clear outliers. Many punters noticed that match results during COVID just didn’t “feel right”. This table confirms it in black and white.
In contrast, the other three seasons (2019–20, 2022–23, and 2023–24) show Yields below the Expected Yield – with the average over the full period matching the Expected Yield almost perfectly.
Have you ever heard of the phenomenon “Regression to the Mean”? This may be a textbook example. So, for 2024–25, the Yield could rise again, as the market stabilises and reverts to long-term averages.
Look at the final row: the Average per Season.
If distribution continues as expected, you’ll have approximately:
- 54 bets in this cluster, and
- 18 wins, giving an observed hit rate of 32.84%.
And if you scroll back to the previous screenshot, note the Longest Losing Streak (LLS): 12 losses in a row. It happened once. Want to double-check the maths? Here’s how: The Science of Calculating Winning and Losing Streaks
⚠️ This is not a strategy for the faint-hearted. As mentioned before, the higher the Betting Yield – and in this case we’re expecting 15% – the bumpier the ride will be.
System Evaluation – Theory vs Reality ⤴️
We are looking at a strategy from the EPL 2024-25 HDAFU Tables – backing the draw in the 1st half of the season with odds between 3.35 and 3.65.
Despite the COVID years (2020–21 and 2021–22), which showed unusually high yields, the other three seasons performed below expectations. Interestingly, the five-year average aligns almost exactly with the Expected Yield of 15%, reinforcing the concept of regression to the mean.
Here’s what we expect for the 2024–25 season:
- ✅ 15.08% Yield
- 📈 32.84% Hit Rate
- 🔁 Profit of around 800 units (staking 100 units each qualifying match)
- 💷 22.44% Return on Stakes Lost (RoSL) = Profitability
We expect around 54 qualifying bets and hope to win 18 of them.
But we’re well aware: this is not a smooth strategy. It comes with volatility, long losing streaks, and plenty of emotional bumps. Still, the numbers suggest it’s a system worth watching.
The Hour of Truth: What We Learned
The system worked. The numbers speak for themselves:
Below is a screenshot from our control spreadsheet used to evaluate this strategy. For those keen to verify or replicate the results, the raw data used (match outcomes, odds, and historical fixture lists) can be downloaded freely from football-data.co.uk – no secrets, no filters.

- ✅ 43 bets qualified
- 🎯 15 wins
- 📈 34.9% hit rate
- 💰 22.3% Yield on flat stakes
So yes, the strategy was profitable in 2024–25 on paper. But – and this is the big lesson – the path to profit was not linear.
In fact, the most brutal lesson came in December, when a painful 8-bet losing streak wiped out nearly all previous gains. That kind of streak feels awful, and the truth is: you never know when it ends. Even though the Fulham v Bournemouth draw on 29 December brought partial recovery, the emotional damage was done. Many punters would have quit.
But this was a system explicitly built for the first half of the season – and by 30 November, it had already generated:
- 🚀 1,502 units profit
- 📊 45.5% Yield
This was well above the Expected Yield of 15%. In a well-disciplined model, this would have triggered a Stop-Loss or Early Exit, banking the profits and walking away before the volatile December dip.
So what should you remember?
| 💡 Key Point | 🟦 Explanation |
|---|---|
| Expected Yield = Compass | Use Expected Yield as a guidepost for what the strategy should deliver on average over the long run. |
| High Yield = High Risk | Strategies with higher Yields usually come with high volatility and longer losing streaks. |
| Results Vary Season to Season | Actual results will swing above or below expectations – but over time, they tend to average out. |
| Use Stop Rules Wisely | If your Yield significantly outperforms expectations early, it may be wise to exit – riding out the rest can backfire. |
🎯 Yield ≠ Efficiency: The Great Confusion⤴️
The Core Misunderstanding
Betting Yield is one of the most quoted stats in punting. It’s easy to calculate, easy to compare, and sounds like a smart benchmark. But let’s be clear:
It’s a basic performance ratio – nothing more, nothing less.
Yet punters, bloggers, and even AI assistants repeatedly call it “efficiency”, as if it reflects the quality or skill of a betting system. That’s a dangerous shortcut – and it’s time we unpick it.
📈 What Yield Actually Measures
Let’s quickly revisit the definition:
- Betting Yield = Net Profit or Loss divided by Total Stakes
- Expressed as a percentage
- Also called Return on Turnover in some contexts
It answers:
Example:
Total bets staked: 2,000 units ~ Net profit: 200 units
200 units
2,000 units
× 100
= 10% (Yield)
🚫 Why Yield ≠ Efficiency
Efficiency implies doing something well, with minimal waste. In business, we talk about:
- Energy efficiency
- Cost efficiency
- Time efficiency
It’s a measure of optimisation.
But yield doesn’t capture:
- Risk – Was the system volatile or stable?
- Skill – Were the wins consistent or lucky?
- Sample size – Did it run over 100 or 10,000 bets?
- Repeatability – Could it be done again?
🔁 Let’s Compare Two Systems
Let’s compare two betting strategies. Both staked the same total amount – £2,000 – but delivered very different results.
| Metric | System #1 | System #2 |
|---|---|---|
| Total Stake | 2,000 units | 2,000 units |
| Net Profit | 200 units | 500 units |
| Yield | 10% | 25% |
| Number of Bets | 200 | 20 |
| Stake per Bet | 10 units | 100 units |
| Hit Rate | 85% | 10% |
| Expected Max LLS | 3 | 28 |
At first glance, System #2 looks much better. It has:
- Higher profit
- Higher yield
But take a closer look…
❗ What’s Really Behind That Yield?
System #1 is built on a high-frequency, high-accuracy model: 200 bets, 85% hit rate, smooth performance.
System #2 is a high-risk, low-frequency sniper: just 20 bets, only 10% hit rate, and a frightening expected losing streak (LLS) of 28.
That means the punter using System #2 must:
- Sustain morale and bankroll through potentially 28 straight losses
- Survive long dry spells while trusting that one big win will come
- Rely heavily on variance working in their favour
Meanwhile, System #1 delivers small but steady profits with minimal risk.
🧠 Which Is More “Efficient”?
#2 has higher yield – but it’s heavily exposed to variance.
#1 has lower yield, but:
- It operates with lower volatility
- It’s more reliable and predictable
- It demands far less emotional and bankroll resilience
So no, System #2 is not more efficient!
It might be more profitable (in this small sample), but true efficiency must consider:
- Consistency
- Risk
- Predictability 👉 Practical sustainability
System #1 is more operationally sound – and in real-world betting, that matters more than flashy percentages.
💼 And the Yield in Finances? Does It Measure Efficiency?
No, it doesn’t. Yield in Finances measures return as a percentage of input:
Bond yield = annual interest payment / bond price
Dividend yield = dividend / share price
No financial textbook calls Yield efficiency.
So why should betting yield suddenly mean efficiency?
The misuse comes from bad habits in betting blogs and social media,
not sound financial thinking.
⚠️ Bottom Line
Calling Yield “Efficiency” is like calling BMI “Fitness”.
It’s a number. It may correlate loosely. But it doesn’t explain how well something functions.
🤖 Why Even AI Gets It Wrong
AI learns from patterns in human writing. In betting circles:
- Yield is frequently mislabelled as “efficiency”
- Popular articles use the terms interchangeably
- Forums and tipster platforms do the same
As a result, AI models (and beginner punters) absorb and replicate the confusion. They inherit the mistake – and spread it.
Unless specifically instructed, even a well-trained language model may parrot the dominant phrasing from its training data: “Yield = Efficiency”.
🦉 Why the Confusion Exists
- Simplicity sells.
Yield is a clean, single number. It looks scientific. It feels like a verdict.
So tipsters, blogs, even analytics tools call it efficiency—because punters want quick answers. -
There’s no real benchmark for ‘efficiency’ in betting.
Unlike engineering or business, where efficiency is measurable, betting lacks a universally accepted framework. So people grab Yield and crown it. -
AI models (including ChatGPT) learn from human misuse.
If 80% of articles and datasets say “Yield = Efficiency”, even the best-trained model needs correction to challenge that logic. -
Most punters don’t understand variance, volatility, or long-term drawdown risk.
So they use Yield as a proxy for success. And then re-label success as “efficiency”.
🧠 Efficiency Requires More Than a Single Ratio
If you want to evaluate a system’s efficiency, you need more than yield:
Risk profile – What’s the max drawdown?
Edge analysis – Were odds consistently above true probability?
Variance metrics – How much randomness is involved?
You might also need concepts like:
PCI (Predictive Confidence Index)
EVI (Edge Volatility Index)
SSI (Streak Stability Index)
These are contextual metrics, not simple ratios – and they paint a fuller picture of how well a system operates.
✅ Summary
| Yield | Efficiency |
|---|---|
| Measures output per input | Measures how well inputs are used |
| Easy to calculate | Requires context and supporting data |
| Blind to risk/volatility | Sensitive to performance stability |
| Used in finance and betting | Rarely confused with yield in finance |
If someone calls it “efficiency”, ask: “Based on what?”
Key Points & Takeaways ⤴️
- Don’t confuse Yield with ROI. They measure different things: ROI looks at net return on invested capital, while Yield relates profit to total staked. Mixing them distorts your view of performance and risk.
- Yield measures return on turnover – not system quality (efficiency). It tells you how much profit you made per 1 unit staked, but says nothing about risk, volatility, or the consistency of your method.
- Don’t ignore risk. Big yields usually come with brutal losing streaks – always check the historical variance and streak data before believing the hype.
- Always relate results to real money. RoSL (Return on Stakes Lost) and ROI (Return on Investment) will help you “feel” profit and loss more honestly than yield alone.
- If you’re a creator, analyst, or tool builder: Use these distinctions in your own work. Demand clear terminology and transparent metrics. Your users will thank you – and so will your own bottom line.
📌 Simulating Strategies & Backtesting ⤴️
What is a Simulation?
The term “simulation” in Soccerwidow’s context refers to a retrospective backtest: We analyse what the outcome would have been if a punter had applied this exact strategy (Draw – 1st Half of Season – Odds 3.35 to 3.65) to all qualifying matches in past five seasons.
No future predictions or assumptions are made. The simulation simply models consistent staking behaviour using actual historical match results.
You may ask: What’s the point of all this?
Throughout this blog, we explain how bookmakers adjust their odds based on public demand – and that they tend to do so consistently, usually around similar risk clusters.
So, why would this EPL Draw – 1st Half of Season cluster have been profitable? Because these matches had an approximate 33% probability of ending in a draw, meaning they should have been priced at odds around 3.0. However, the public likely underestimated the draw outcome, believing one team was more likely to win. As a result, money flowed towards either the home or away side, putting pressure on the market – and forcing the bookmaker to inflate the draw odds in order to balance liabilities.
But before you take this as a rule of thumb: This example is based on the EPL 2024–25. While this trend may well continue in the Premier League, it doesn’t necessarily apply to other leagues – each has its own unique market behaviour and public sentiment.
📌 What is the Expected Yield? ⤴️
The Expected Yield is a theoretical benchmark. It’s what the Yield should have been – if all the bets had lined up neatly over the five years, like little soldiers, evenly spread within the selected odds cluster (in our example case study: 3.35 to 3.65).
The formula is:
Average Odds
Zero Odds
– 1
Zero Odds are simply:
1
Hitrate
Zero Odds are the breakeven point – the odds that would have returned exactly zero profit if matched with the observed hit rate.
At this stage, we’ve counted the number of qualifying matches, calculated their average odds, and the zero odds from the observed hit rate.
But we haven’t yet examined how the actual wins and losses have been distributed.
For you to remember:
The Expected Yield gives you a clean theoretical reference point.
Whether the system actually lived up to that will become clear once you look at the real results.
Stay tuned for upcoming articles introducing Soccerwidow’s four four core metrics – designed to revolutionise how betting systems are evaluated and compared.:
- Edge Volatility Index (EVI):
Captures how stable (or erratic) profits of a systems really are over time. Based on profit volatility – it reveals whether a system delivers results smoothly or in wild, unpredictable swings. The higher the index, the more stable and trustworthy the system. - Yield-Surprise Index (YSI):
Shows how much the system’s actual yield beats (or lags) the expected yield implied by the odds.
High = genuine edge
Low = under‑delivery or pure luck. - Streak Stability Index (SSI):
Quantifies emotional and psychological stress from long winning or losing streaks. A high SSI means the system delivers outcomes in a balanced, less nerve-wracking rhythm – ideal for bankroll and mindset alike. - Predictive Confidence Index (PCI):
Measures how trustworthy the past betting results are as a guide to future performance. It combines volatility (how bumpy profits were) with sample size (how much data supports the pattern), and expresses the result on a simple 1–10 scale. High PCI means strong, repeatable results; low PCI warns you the edge might be just noise.
© Soccerwidow. Feel free to share – just please credit us. And if you’ve got something to add, we’d love to hear it.
🕓 Published: 11 July 2025
✍️ Written by The Soccerwidow