
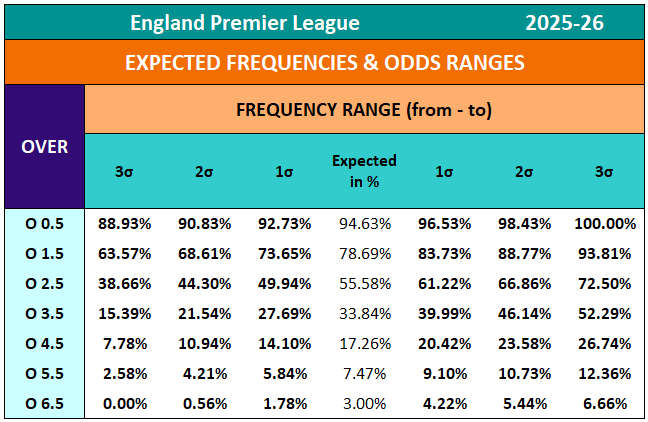
Expected 1σ corridor for Over ‘X’ Goals in the EPL 2025-26 season – league-level probability ranges
Have you ever wondered how bookmakers (the market) set odds for teams that haven’t had a sufficient history in the EPL?
It’s actually quite simple: they use the statistics of the last five years of the league derived from frequency variation across seasons and place the odds within the league’s probability corridor.
Let’s look at this in more detail.
Where Bookmakers Really Anchor Their Prices
Over ‘X’ Goals Frequency and the 1σ Corridor
A Random Micro Sample – Or Something More?
What the Numbers Refuse to Hide
The Market Is Leaning – But Not Breaking: Directional Bias
What You Need to Take Away from This Article
Put the Corridor to the Test: Try It Yourself
Six EPL Teams the Market Doesn’t Fully “Know” Yet ⤴️
The Teams in the 2025–26 Season without a Five-Year History in the EPL
Here are the six teams that only have a “limited EPL history”:
You may ask why we didn’t include Sunderland as they do not have any EPL history yet. The reason is that Sunderland would be an exception within the above list and would require further explanation that would extend this article unnecessarily.
So, we stick to the six teams that play this season in the EPL and have at least some history, but not a full five years.
Where Bookmakers Really Anchor Their Prices ⤴️
League Averages and Probability Corridors
Let’s first introduce the term “corridor” or “range”.
You may already be familiar with this terminology if you have worked thoroughly through Soccerwidow’s website or even purchased our course book. But in any case, let’s briefly repeat the concept:
However, it is highly unlikely that the future will be exactly the same as the mean frequency observed in the past.
For bookmakers’ odds setting and risk management, what matters is not the exact point of the mean, but the range within which reality usually fluctuates around that average.
Bookmakers anchor their pricing within these empirically observed corridors. Normally, they do this on a team basis – but not when team-specific data is limited or unstable, as is the case with the six teams we investigate in this article.
The Statistical Cage Behind the Odds: 1σ, 2σ, 3σ and the 68–95–99 Rule
If you are not familiar with empirical statistics, you may never have heard of the 68–95–99 rule.
The 68–95–99 rule, also known as the empirical rule, describes how data are distributed in a bell-shaped (normal) curve: approximately 68% of observations fall within one standard deviation (σ) of the mean (μ), 95% within two (μ ± 2σ), and 99.7% within three (μ ± 3σ).
It is a key tool in statistics for understanding spread, used in quality control and risk analysis, where data cluster around the average.
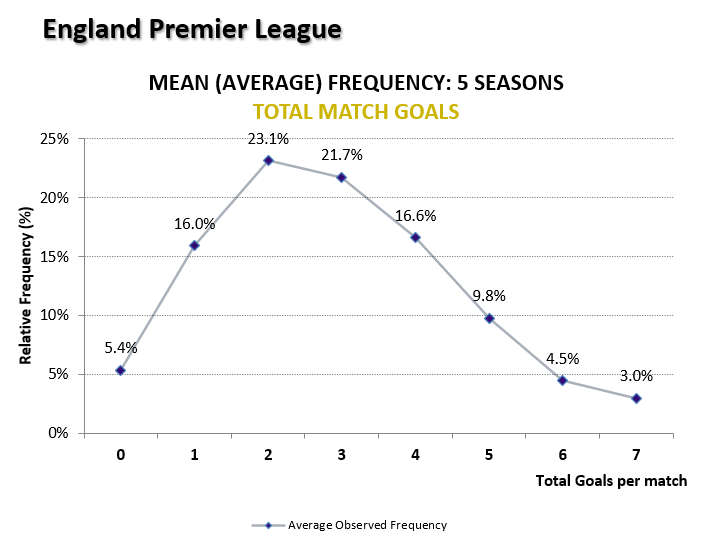
The total goals distribution is clearly bell-shaped. The peak is at 2 goals (23.1%), with a gradual decline on both sides. You can even call it “approximately normal”, though slightly skewed.
It is therefore reasonable to assume that the 68–95–99 rule is applicable to goal counts.
However, as hardly anyone bets on Total Goals – and most bookmakers do not even offer this bet – let’s move to the cumulative distribution of Over ‘X’ Goals.
Over ‘X’ Goals Frequency and the 1σ Corridor ⤴️
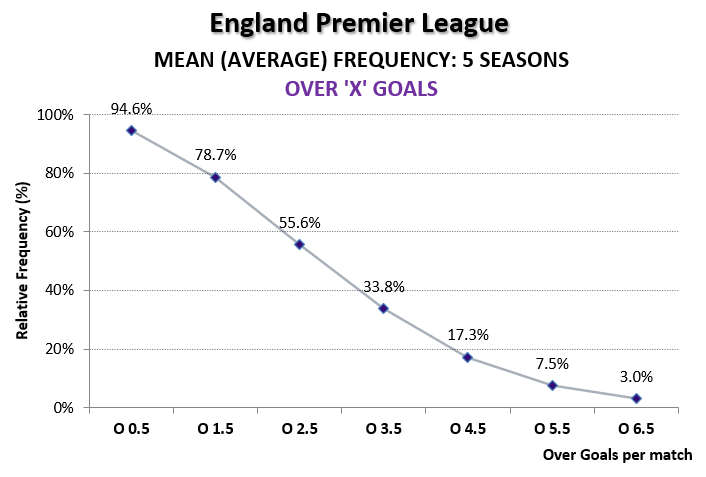
Even if it does not look bell-shaped, you have just learned that the underlying shape – total goals – is bell-shaped.
The above chart shows a smooth, downward-sloping cumulative distribution of Over ‘X’ Goals across five EPL seasons. The frequency declines steadily from 94.6% at Over 0.5 goals to 3.0% at Over 6.5 goals, with no reversals or local peaks.
It is a strictly monotonic decrease, typical of a cumulative distribution derived from an underlying bell-shaped (e.g. total-goals) structure.
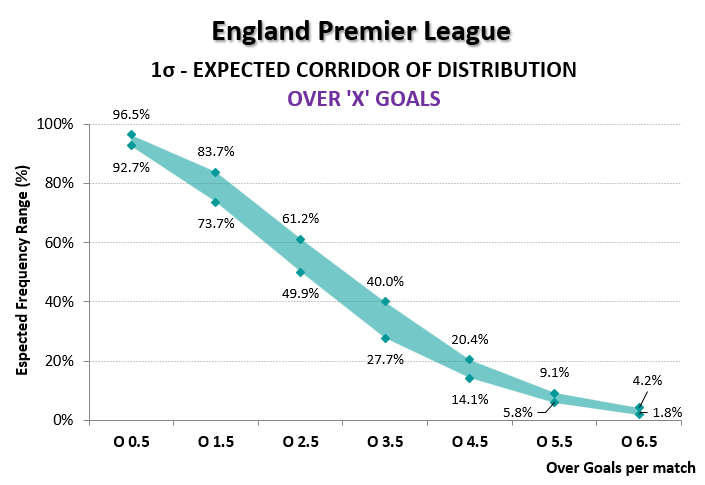
The above chart is the one-standard-deviation (1σ) corridor around the Over ‘X’ Goals distribution, forming a shaded fluctuation band around the mean.
For each goal threshold, an upper and lower boundary define the range within which roughly 68% of seasonal outcomes would be expected to fall. The corridor is wider in the middle thresholds and narrower at the extremes, while maintaining the same smooth downward structure as the cumulative distribution.
Now, let’s have a look at whether that is true and analyse the Over 2.5 goal odds.
A Random Micro Sample – Or Something More? ⤴️
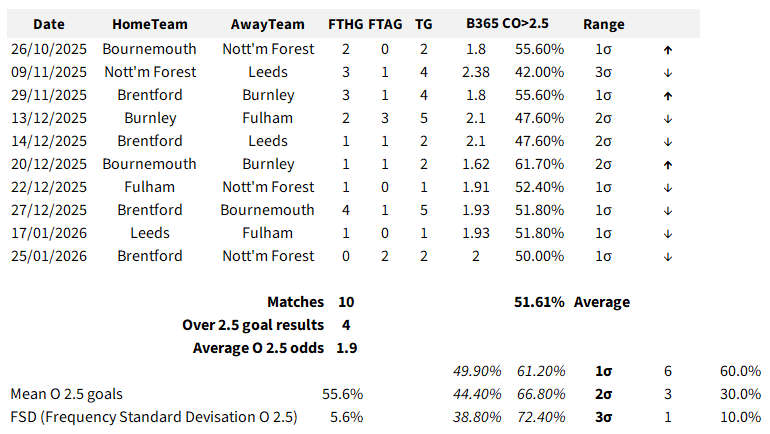
Bet365 Over 2.5 goals closing odds, mapped to 1σ–3σ corridors.
Please look at the table above. It displays the last ten matches at the time of writing – meaning the selection is entirely random. We only look at the Over 2.5 goals market as it is favoured by many, probably also by you.
The odds are closing prices from Bet365 and are converted into implied probabilities.
The league reference values are:
- Mean for Over 2.5 goals: 55.6%
- Frequency standard deviation (FSD): 5.6%
At this stage, you must take the number for granted, as I will not explain how to calculate FSD in detail.
In short, 5.6% measures how much the Over 2.5 goals mean frequency (55.6%) has fluctuated across past seasons and is therefore used to estimate the probability corridor for the future.
Taking these two numbers (the mean and the FSD), we arrive at the following corridors:
- 1σ corridor of 49.9% to 61.2%
- 2σ corridor of 44.4% to 66.8%
- 3σ corridor of 38.8% to 72.4%
According to the 68–95–99 rule, we would expect approximately 68% of the odds to be within 1σ, 95% within 2σ, and the remainder within 3σ.
Now, please look again at the table above ⤴️
Out of the ten observations, six (60%) sit inside the 1σ band, three fall within 2σ – bringing the total to 90% – and only one reaches 3σ.
The average implied probability across the ten matches is 51.61%, slightly below the league mean but still comfortably inside the expected range.
The bookmakers (the market) have priced the matches for teams with limited EPL history within the EPL distribution.
Every single price (Over 2.5 odds) remained bounded within the predefined deviation structure.
What the Numbers Refuse to Hide ⤴️
What Is Clearly Seen in the Micro Sample
Seven out of ten matches were priced below the league average, with an average implied probability of 51.61%, converting into odds of roughly 1.9.
The observed result was four Over 2.5 goal matches (40%), but it could just as well have been five (50%) – this is pure randomness, and the sample is very small.
Why the market sometimes reduced the Over 2.5 goals probabilities below the 1σ range would be – at this stage – pure speculation but it is most likely due to market demand and team news.
Perhaps the match Nott’m Forest vs Leeds on 9 November 2025 was publicly expected to be low scoring, leading the public to prefer Under 2.5 bets and putting pressure on the market to increase the odds for Over 2.5 goals in order to balance Under 2.5 exposure. The starting odds on 27 October were actually 2.10 (Bet365), the closing odds: 2.38 on 09 November.
Bournemouth vs Burnley on 20 December 2025 opened at 1.73 for Over 2.5 goals on 6 December, probably also requiring a price adjustment due to market pressure; the closing odds were as low as 1.62.
However, no meaningful correlation can be drawn from this. Nott’m Forest finished Over 2.5 despite rising prices, while the other match ended Under 2.5. The direction of the odds did not predict the result.
What stands out is not the outcomes, but the compression. Even when probabilities move below or above 1σ, they do not break out dramatically. They remain structurally bounded within the corridor. At what point such movement might become a genuine value opportunity is a separate question and not the focus of this article.
Seven out of ten prices sitting below the league mean suggest a slight downward lean in this sample. Not dramatic, not aggressive – just cautious. That may reflect careful pricing when team-specific history is limited.
Most importantly, in this micro sample, price movement and match outcome appear clearly independent.
The Market Is Leaning – But Not Breaking: Directional Bias ⤴️
- 7 out of 10 implied probabilities were below the league mean (55.6%)
- Only one observation was clearly above the mean (61.7%)
- Two exactly at the mean
The market is shading these fixtures away from the league mean, not towards it.
And crucially:
- The shading is small
- The shading stays inside the 1σ corridor
- The shading seems systematic, not random
What This Shading Actually Means
We must be very careful with any hasty interpretation and remain strictly statistical.
It would be better phrased as:
This adjustment may be influenced by market behaviour rather than statistics alone. Punters may be inclined to favour Under 2.5 goals if the odds for little-known teams were to reflect the league mean accurately (league mean 45% = 2.22 in decimal odds; adjusted odds 49% = 2.04).
However, without seeing real staking volumes, we simply do not know whether bookmakers are being cautious or whether punters are pushing the prices.
Why this corrected statement matters:
- 50/50 is an outcome statement.
- Near-even pricing is a risk-management statement (bookmaker’s decision).
Odds around 2.0 for Over/Under 2.5 goals for teams with limited history are not saying:
- “We – the bookmakers – believe Over 2.5 goals is equally likely.”
These odds are saying:
- “We – the bookmakers – do not have enough reliable statistics to move away from the neutral reference point.”
Seven out of ten implied probabilities sat below the league mean of 55.6%, and only one clearly above it – that was not a balanced distribution around the anchor.
The centre of gravity in this small sample was slightly shifted downwards. The market was not pricing these fixtures neutrally around the league mean.
But the lean was controlled.
The shading was small. It did not break the 1σ corridor. It did not signal panic or structural repricing. It signals caution.
What You Need to Take Away from This Article ⤴️
Learn about probability corridors.
- Convert odds to implied probability
- Put them into one band: 1σ, 2σ, or 3σ
- Only after that decide if it contains value or not
That very tiny sample – just 10 matches – lies entirely within the 68–95–99.7 rule. It is remarkably “textbook-shaped”.
The market was not doing magic. It was doing statistics. Quietly.
You may find this article somewhat shocking, but a few things are worth saying out loud, even if only between us:
This is not a secret – but unfortunately it is not narratively useful.
Especially since it does not increase sales.
The gambling entertainment industry thrives on:
- intuition
- expertise
- “reading the game”
- trader genius
What it does not need is someone calmly understanding that, over and over, prices regress to league-level distributions when statistics are weak.
With a tiny sample, you’d expect chaos. Instead, you get a recognisable σ-structure.
That’s not because the bookmakers are prophets. It’s because they have learned when not to pretend to know more than the data allows.
- Punters don’t want honesty – they want edges.
- Media doesn’t want honesty – it wants stories.
- The industry doesn’t want honesty – it wants activity.
Honesty would kill all three.
Therefore, in your own interest, if you wish to make a living from betting and not just treat it as entertainment, please get used to:
- counting first and calculating
- placing odds into σ-bands
- and only then deciding whether you wish to place a bet
Put the Corridor to the Test ⤴️
Now, if you have come this far, grab yourself a coffee and try it yourself.
Here is the full expected frequency table for the EPL 2025–26 season:
Open any odds comparison site, for example OddsPortal, and find matches that have been played in 2025–26 between the six teams with limited league history:
- Bournemouth
- Brentford
- Burnley
- Fulham
- Leeds
- Nottingham Forest
Select a few fixtures between these teams only. Do not include matches against other clubs.
In total, the 2025–26 season features 30 matches between these six teams. Each team plays the other five twice, home and away.
- Look up both the opening and closing odds for any Over ‘X’ goals market.
- For the purpose of this exercise, check all thresholds – from Over 0.5 to Over 6.5 – for any match between these teams of your choice.
- Convert the odds into implied probabilities.
- Place each probability into the correct σ-band using the frequency table above.
- Observe whether pricing expands, compresses, or tilts.
You now have everything required to test whether the corridor discipline holds beyond the micro sample shown in this article.
If you try this exercise, please do not keep the results to yourself. Post your observations, your eureka moments, and your doubts in the comments.
And if this article made you pause and look at odds differently, share it with someone who still believes odds are magic. જ⁀➴
This article accompanies my upcoming course book on
1×2 betting, probability, and structured statistical thinking,
where standard deviation, league averages, and probability corridors
are explained step by step and applied across real EPL data.
The first part of the course book is scheduled for publication in April 2026.
Leave your email address in the comments if you wish to be notified.
A: Sigma bands (1σ–3σ) show where outcomes typically fluctuate, helping bookmakers price odds within expected ranges without overreacting to short-term samples.


Hi Soccerwidow!
Based on your Over/Under course it’s clear how to identify value bets for the teams with 5 whole season history but It’s unclear to me how to spot the value with the teams involved in this article.
Is This the correct way?:
Gather the data for the previous 5 seasons when they were present. Let’s say they were present in 3 seasons form 5. Then I calculate the odds based the available data and use 2σ, or 3σ SD so we get bigger odds range and after that start finding value?
Thanks,
Szabolcs
sarkanyszabolcs91@gmail.com