
2020 Summer League HDAFU Tables: Coronavirus Trial – ‘Live’ Picks
Since the 1st July, we have been running a live picks experiment using systems selected from our HDAFU Tables to see if Covid-19 is affecting results one way or another.
As of Sunday, 2nd August 2020, a total of 91 picks had been published in advance of kick-off times in four different ‘summer’ leagues.
The HDAFU systems chosen are all 1st half-season systems only, with the experiment due to finish on the 26th of August when the latest scheduled of these, the Finnish Veikkausliiga, reaches its midway point.
The four leagues are:
- Finland Veikkausliiga (2x draw systems)
- Iceland Úrvalsdeild ~ AKA Pepsideild (1x draw system; 1x favourite win system)
- Norway Eliteserien (1x draw system; 1x home win system; 1x favourite win system)
- Sweden Allsvenskan (1x draw system; 1x favourite system)
Expectations for the portfolio as a whole were as follows:-
Mathematical Advantage (Expected Yield) = 27.61%
Total number of bets expected until the end of the 1st halves in each season = 196
So far, from the expected number of 196 bets, 91 have been played (46.4%), with 36 winning (hit rate: 39.6%). The hit rate is minus 6.9% of expectations. Later in this article, we will see if we can identify a culprit (or culprits) in our chosen systems.
Betting Bank Development
The Portfolio Probability or average expected hit rate was 47.07%. This probability is very close to throwing a dice (i.e. 50/50) and, as with a dice roll, an element of luck is required to see your choice of heads or tails coming up more often than not.
Unfortunately, luck was not on our side as the experiment developed… 🙁
It did have a promising start and grew from 3,000.00 units (starting bank) to 3,213.54 units in the first four days before diving into a long run of unprofitable rounds. This illustrated in the following graph showing the running total:
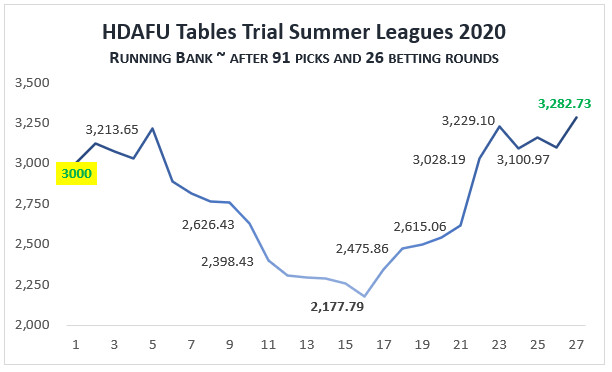
After day four, the portfolio saw a losing streak of 11 betting rounds (rounds 5 to 15: July 5th to July 18th, 2020) taking the bank down to its lowest point of 2,177.79 units (67.8% of the highest bank), almost activating our Stop-Loss mechanism (set at 60% of starting bank), where stakes would have been reduced on future bets.
The ratchet system we used kept the stakes constant using the high-water mark of 3,213.65 units (i.e. highest point the bank reached) as the gauge against which to calculate our exposure on each bet. Read here for more explanations of what a ratcheted staking plan actually is: Sound Staking: Flat Stakes & Ratcheting
The ratcheting method of staking helped the bank to recover faster as soon as results once again began to go our way – it is now, after a truly bumpy ride, at a new high of 3,282.73.
Lesson #1: For those who use the HDAFU Tables for betting, sit tight and give yourself a chance! Do not give up too quickly! Continue religiously choosing the picks according to the criteria you set when choosing your systems. More often than not, your bank will eventually recover.
Always remember: You are playing statistics that behave randomly; your luck may come in big chunks of good or bad, or may be more regularly distributed.
System Performance Review
Of course, with the deep trough at the start of our portfolio, we went digging to see what may have been the root cause.
You can see in the graph below the nine different systems and the number of bets played as at August 2nd, 2020: e.g. Finland Draw (II) had 11 bets played at this date. The graph also compares the expected hit rates and the observed hit rates of each system.
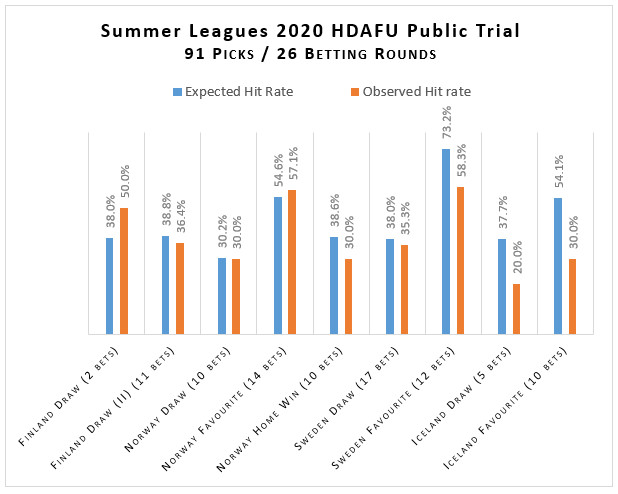
Most of the systems have, after 26 betting rounds, achieved their expected hit rates.
The systems that have developed hit rates far below expectations are:-
- Sweden Allsvenskan: Favourite system
- Iceland Úrvalsdeild: Draw system & Favourite system
Below is a graph showing the Profit/Loss made by all nine systems after 26 match days:
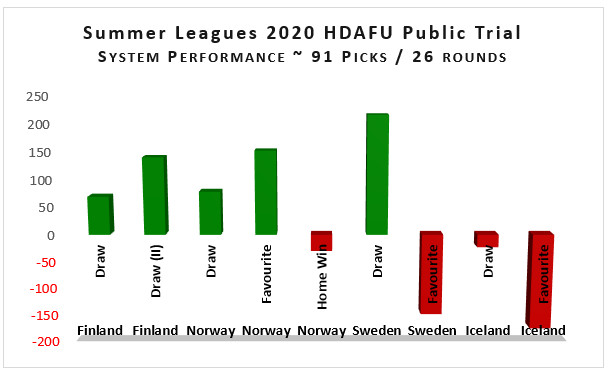
As you can see from looking just at the observed hit rates, the ‘Favourite Win’ systems of Sweden and Iceland are producing deficits.
The Draw system in Iceland isn’t doing as bad and may even recover. But, we must be careful as the originally expected hit rate was low at 37.7% and from 11 expected bets five of these have already been played.
The main culprits that seem to be affecting the portfolio as a whole are obviously the ‘Favourite Win’ systems in Sweden and Iceland.
Nevertheless, it is too early to conclude that Covid-19 is affecting these systems, although it would be easy to associate the lack of crowds and thus, reduced home advantage, with the failure of these home win dominated systems. After all, the Norway ‘Favourite Win’ system is performing quite well.
To shuffle the pack, we will remove the two losing systems from our running total calculations and separate them from the other picks so we can monitor their progress in isolation. If you are following our Sweden and Iceland favourites with real money then perhaps hold fire for the time being and stick to the other seven systems.
Lesson #2: For those who use the HDAFU Tables for betting, review your systems once per month (or at least after every 100 bets)!
If you have obvious duds bringing the house down, don’t be afraid to remove them from your betting portfolio.
Of course, you can, if you wish, try to replace the losing systems with other systems. It doesn’t matter if you start and stop a system during the middle of any season: Starting or Pausing Your 1X2 Portfolio in the Middle of a Season


Hi,
would you be so kind to explain how to calculate a deviation from the expected hitrate after x number of matches in a system with 73.2% probability as mentioned in the comments, it should be +/- 10% but I don’t know how you calculated that.
Thank you
Hi Elena,
You state “ If you have obvious duds bringing the house down, don’t be afraid to remove them from your betting portfolio”.
The question of course is when? Given the random nature of distribution of winning bets, when can one reasonably expect systems are not going to recover? Is there some sort of formula you would use?
No, there isn’t a formula just common sense. For example, the Sweden Favourite system had 31 bets expected in total for the first season with 22 winning bets (73.2%) and observed during July were 15 bets with 8 winning bets (53.3%).
Yes, distributions are random but after 15 bets with a probability of 73.2%, you would have expected to observe a deviation from the expected hitrate of +/- 10%, not -20%!
The Iceland Favourite system even had a -24.1% deviation and, in addition, the expected average odds were 2.32 but the odds actually achieved only 2.18. Two factors that contributed to the decision to kick out this system from the portfolio.