Possible Causes of the Oddsportal Errors
So why is Sportingbet’s figure so high compared to the others?
We can only guess that the 4.30 figure shown is an in-play price, perhaps when the home team were behind in the game or, near the end of the match when there was little time for either team to find the winning goal.
Or, perhaps the odds were entered manually and the 4.30 price should have been the away team odds (which would make more sense as the away odds are missing).
Whatever the origins of this problem it is just a small glitch in Oddsportal’s system and to be fair to this otherwise excellent Web site, problem odds such as this appear more regularly in seasons before the 2010 calendar year.
Oddsportal seem to have resolved the problems thereafter.
How do we go about correcting the set of prices for this game? The obvious way is to take a calculator, add up each column ignoring the Sportingbet figures (even for the draw) and then find the new averages. Of course, determining the highest prices would have to be a manual job carried out by eye.
We suggest you do just this now before proceeding with the rest of this article…
Correcting False Football Betting Odds Using Excel
Excel makes rectifying problems such as this a much easier task and for this particular problem two simple formulas are needed: the “AVERAGE” and “MAX” formulas, the usage of which we will explain in detail later.
We will also mention the “HARMEAN” formula, which is appropriate for finding a more relevant and usable average figure.
To begin the process of correcting the error, simply ‘copy’ the odds from the Oddsportal page.
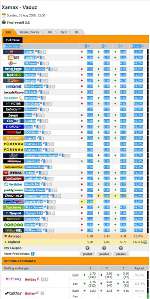
To do this, place your cursor to the left of the word “Bookmakers” in the top left-hand corner of the tab and with the left mouse button pressed, drag down to the opposite corner and release the button when the final “Payout” figure is highlighted. Do not highlight the average or the highest odds.
The screenshot on the right pictures this description.
Again, click on the image to enlarge it in a new tab and then use the magnifier provided to increase the size further.
Next, place the cursor anywhere on the blue highlighted area and right click to produce a menu of possible operations. Choose “copy” and left-click with the mouse.
In a fresh Excel spreadsheet choose a cell and right-click on it. Choose “paste” from the menu presented and left-click to transfer the information copied from Oddsportal into the Excel sheet.
Check that the 1×2 odds all line-up and then delete the rogue entries.
Because Sportingbet’s home win price is obviously wrong, the chances are that their price for the draw is also awry, so it is sensible to delete all entries for any bookmaker showing any home, draw or away aberrations.
At the bottom of each of the three odds columns we now need to enter our formulas. Firstly, the “AVERAGE” formula is simply entered in the cell beneath the odds, and an example of this formula is:
This formula as it is written will calculate the numerical average value of all the odds shown in the column range from cell C5 to cell C36.
Below the cell with the AVERAGE formula, we will now calculate the highest value in the column without having to rely on scanning through the list and working it out by eye.
Just use the following formula:
Effectively, this formula seeks out and shows in its target cell the highest or ‘maximum’ value in the list.
The third of our formulas is the ‘harmonic mean‘ and is used to find the most balanced average figure. (We strongly recommend you follow this link and read this article to fully understand harmonic mean as it is a vital concept to grasp when analysing data to give a more correct overview of a set of odds):
Of course, just change the letters and numbers in the parentheses (brackets) to suit the column letter and the range of results you are analysing with any of these formulas.
You may have already guessed that you can also copy all three average and/or highest home, draw and away prices from Oddsportal by using the same copy/paste method as described above. Just sweep your cursor with left-hand mouse button depressed across the three prices, release the button to highlight them, and then right-click on the blue highlighted area to copy them.
They can then be pasted into three separate columns in any Excel spreadsheet and will save you a lot of wasted time typing in required figures individually.
Have you worked out what you think the correct average and highest 1×2 odds might be?
This is your last opportunity before we tell you the answers on the next page…


